


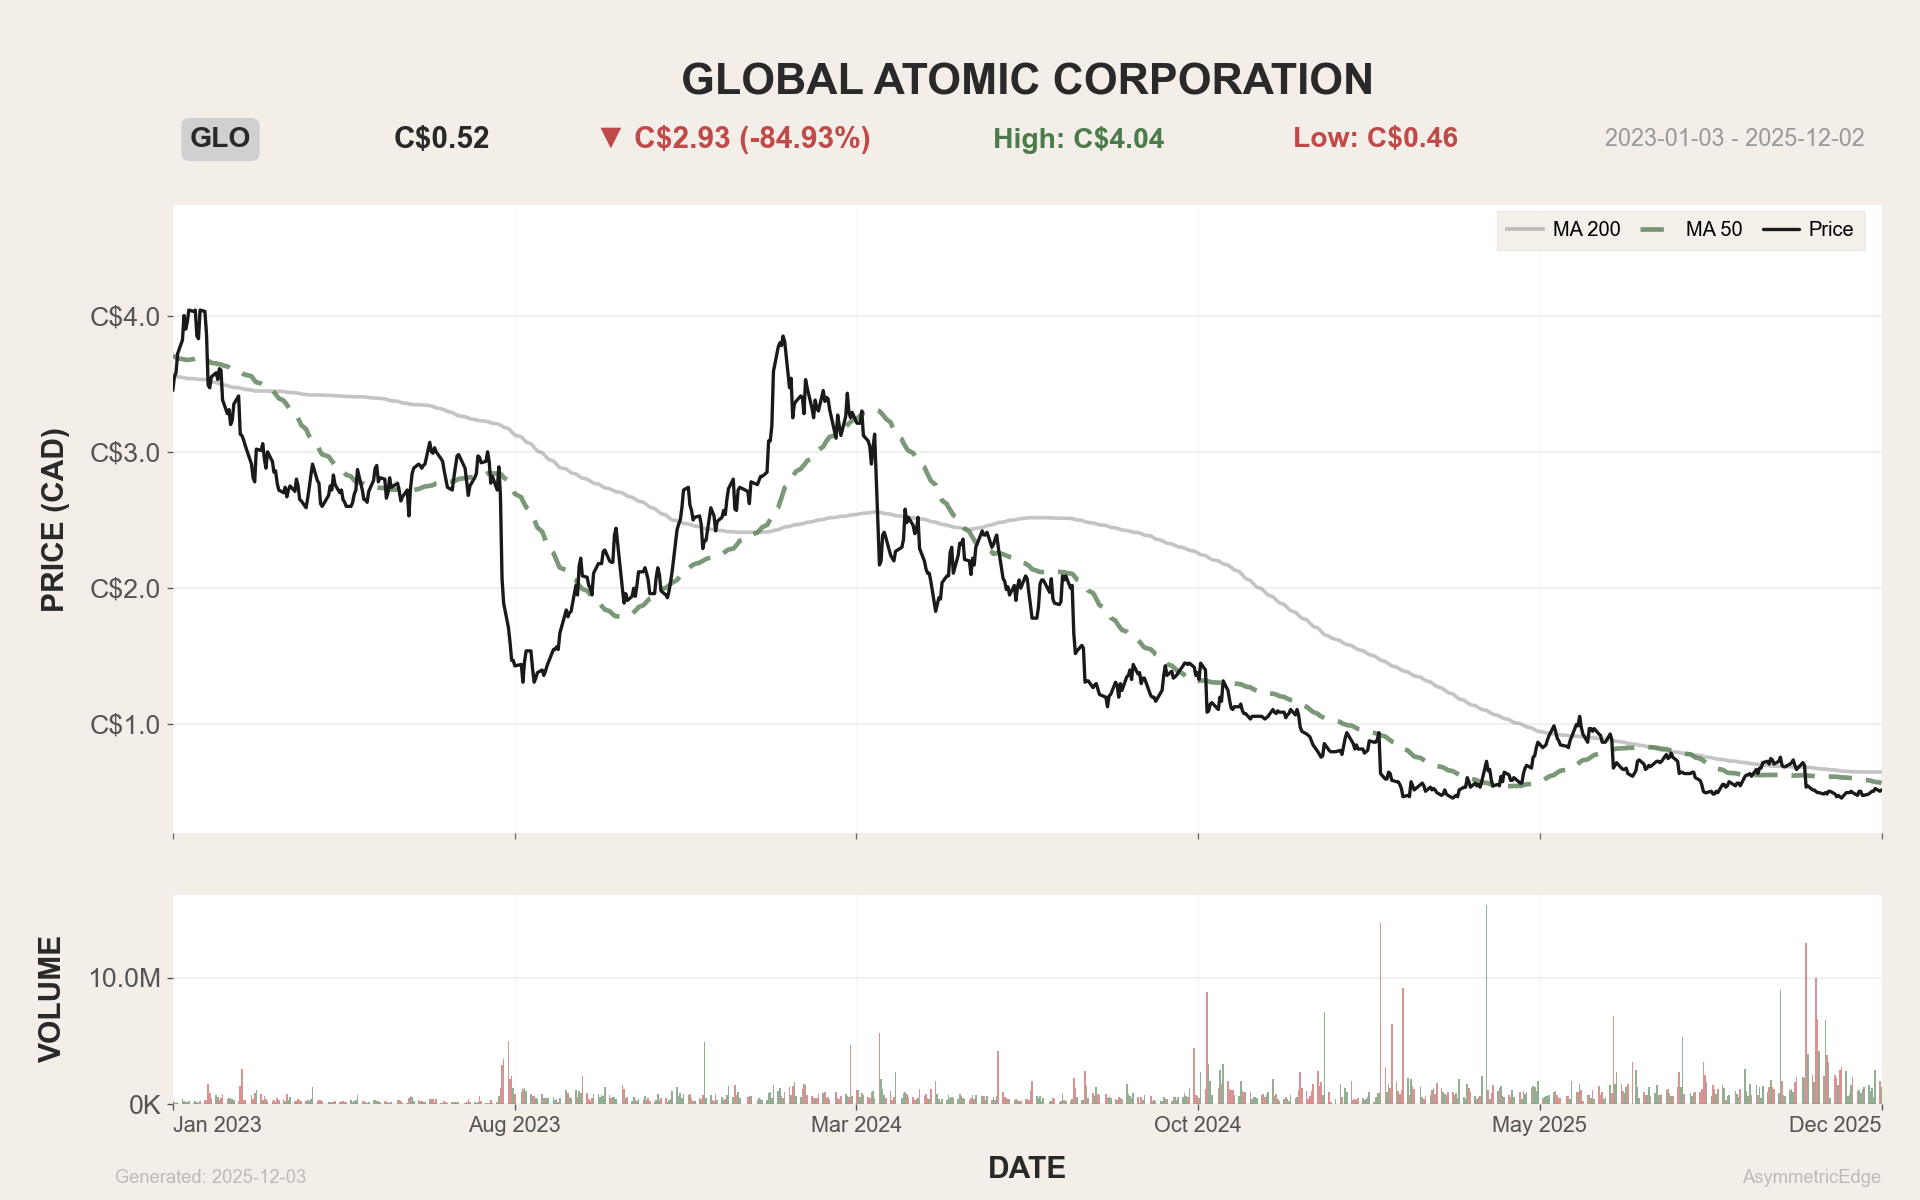
Global Atomic’s share price has declined over the past two years amid Niger’s political transition, extended financing timelines, and equity dilution. The stock now trades at a meaningful EV/NPV discount — a gap that may reflect uncertainty rather than mispricing.
To understand what the market may be anticipating, I built a 10,000-run Monte Carlo model of Dasa, simulating the economic variables that actually move project value. The result is not a single number, but a distribution — and a clearer view of how risk and value interact.
1) Company Snapshot & Market Context
Global Atomic is a small-cap Canadian uranium developer whose valuation is driven almost entirely by a single asset: the Dasa uranium project in Niger.
The company also owns 49% of a zinc-recycling joint venture in Turkey, which generated roughly US$2.6M in EBITDA and US$1.4M in net income in Q3 2025. The JV helps offset corporate G&A, but it is small relative to Dasa, cyclical, periodically disrupted, unable to support mine-construction financing, and irrelevant to Niger-specific geopolitical risk.
For valuation purposes, this makes Global Atomic effectively a single-asset developer. Accordingly, this analysis focuses exclusively on the economics of Dasa and does not incorporate:
any contribution from the zinc-recycling JV
potential mine-life extensions beyond the current Feasibility Study
future expansion or optionality not included in the current mine plan
exploration upside
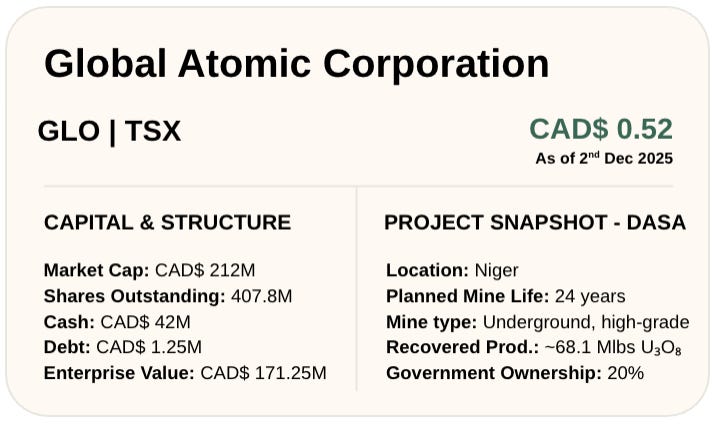
Here is how Global Atomic looks today from a capital-markets perspective:
Why the stock sold off:
In July 2023, Niger underwent a political transition in which the previous government was removed and a military-led administration took power. Following the transition, international partners — including development finance institutions, export-credit agencies, and Western governments — undertook standard sovereign-risk reviews, which generally occur when a country’s governance structure changes.
Several Western governments also reassessed their strategic relationships with Niger, and in 2024 the transitional administration formally ended the U.S.–Niger military cooperation agreement, after which the United States withdrew its military personnel. These developments contributed to a more cautious external risk environment and lengthened lender due-diligence timelines.
As a result, the Dasa debt facility moved through a slower review cycle, requiring re-validation of approvals and legal frameworks under the new administration. With debt financing delayed, Global Atomic raised equity to maintain construction progress. The combination of extended timelines, dilution, and updated CAPEX estimates contributed to a multi-year decline in the share price despite continued on-site advancement.
The chart below shows how these events correspond with Global Atomic’s multi-year share-price decline.
2) Project Overview
Dasa is one of the highest-grade undeveloped uranium projects globally, with a technically robust underground mine plan and modeled costs that position it in the lower-cost tier of conventional uranium developments. The geology is not the key risk driver — the challenges lie in jurisdiction, financing, and timing.
From a project-engineering standpoint, the key strengths are:
High-grade ore with strong geological continuity
A straightforward underground development plan
Competitive operating costs and low projected AISC (All-In Sustaining Cost)
Attractive economics in the 2024 Feasibility Study (NPV/IRR)
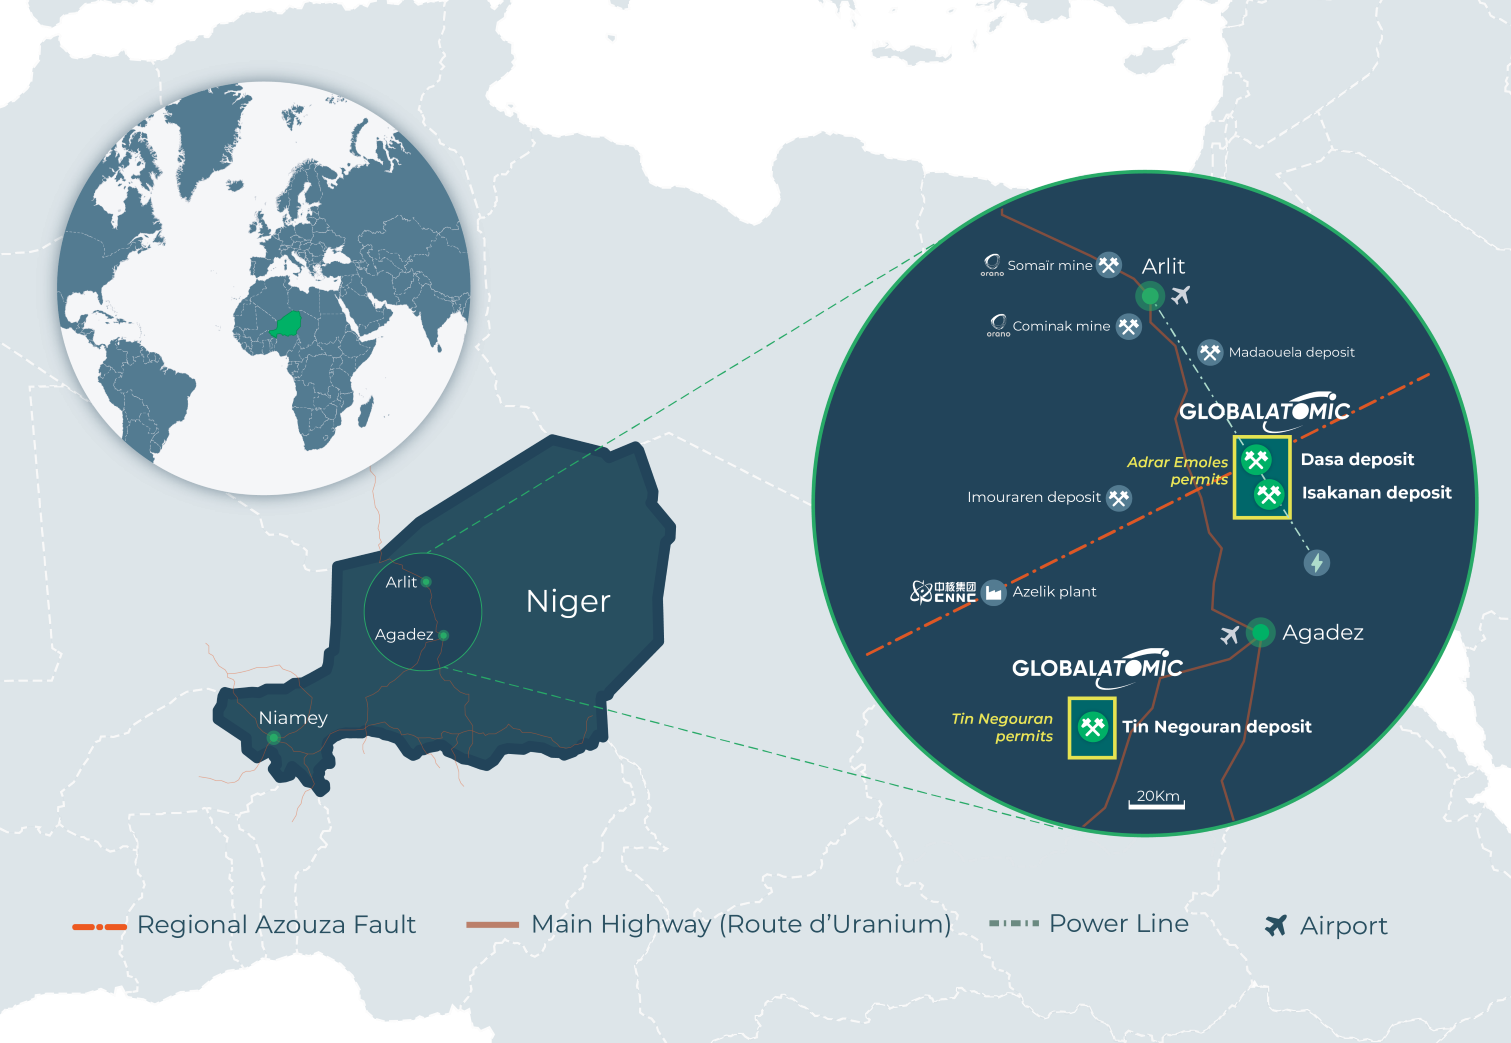
These fundamentals form the basis of the Monte Carlo valuation — the engineering case is strong before applying country-level and execution uncertainty.
The next step is understanding where the project stands today.
2.1 Construction Progress & Schedule Status
Dasa is visibly advancing on the ground, with major components of the mine and site infrastructure already in place. Underground development is well underway, critical plant equipment has arrived, and civil works are largely complete. However, the schedule has slipped by roughly two years relative to early guidance, driven primarily by financing-related delays and sovereign-risk review.
What’s Completed
1,200+ meters of underground development
Multiple mining levels opened
10,000+ tonnes of development ore stockpiled
Civil works & concrete foundations largely complete
Major plant equipment on site:
SAG mill
Primary crusher
Acid plant components
90-tonne crane
Infrastructure built: power, water, workshops, 260-person camp
What’s Delayed
Original first production target: Q1 2025
Current target: Q1 2027
Delay drivers:
U.S. development-bank financing timeline
Sovereign-risk assessments during Niger’s political transition
Updated engineering designs requiring additional lender review
Next Major Milestone: H2 2026
Processing-plant commissioning — equipment installation, testing, calibration
Typically the highest execution-risk phase of any mining project
Bottom Line
Dasa is advancing meaningfully on the ground — underground development, foundations, and major equipment deliveries are all in place. But the most capital-intensive portion of the build still lies ahead, and it cannot proceed until the debt package closes. This is why the construction schedule has shifted: once funding is secured, execution risk drops and timelines become far more predictable.
2.2 Financing & Equity Dilution
Global Atomic has been pursuing a US$295M project-finance facility with a U.S. development finance institution — a debt package that, if approved, could fund roughly ~60% of Dasa’s remaining CAPEX. This prospective facility remains the central milestone for the project. As of late 2025, it is still non-binding and under review, with timing affected by standard lender sovereign-risk assessments following Niger’s political transition.
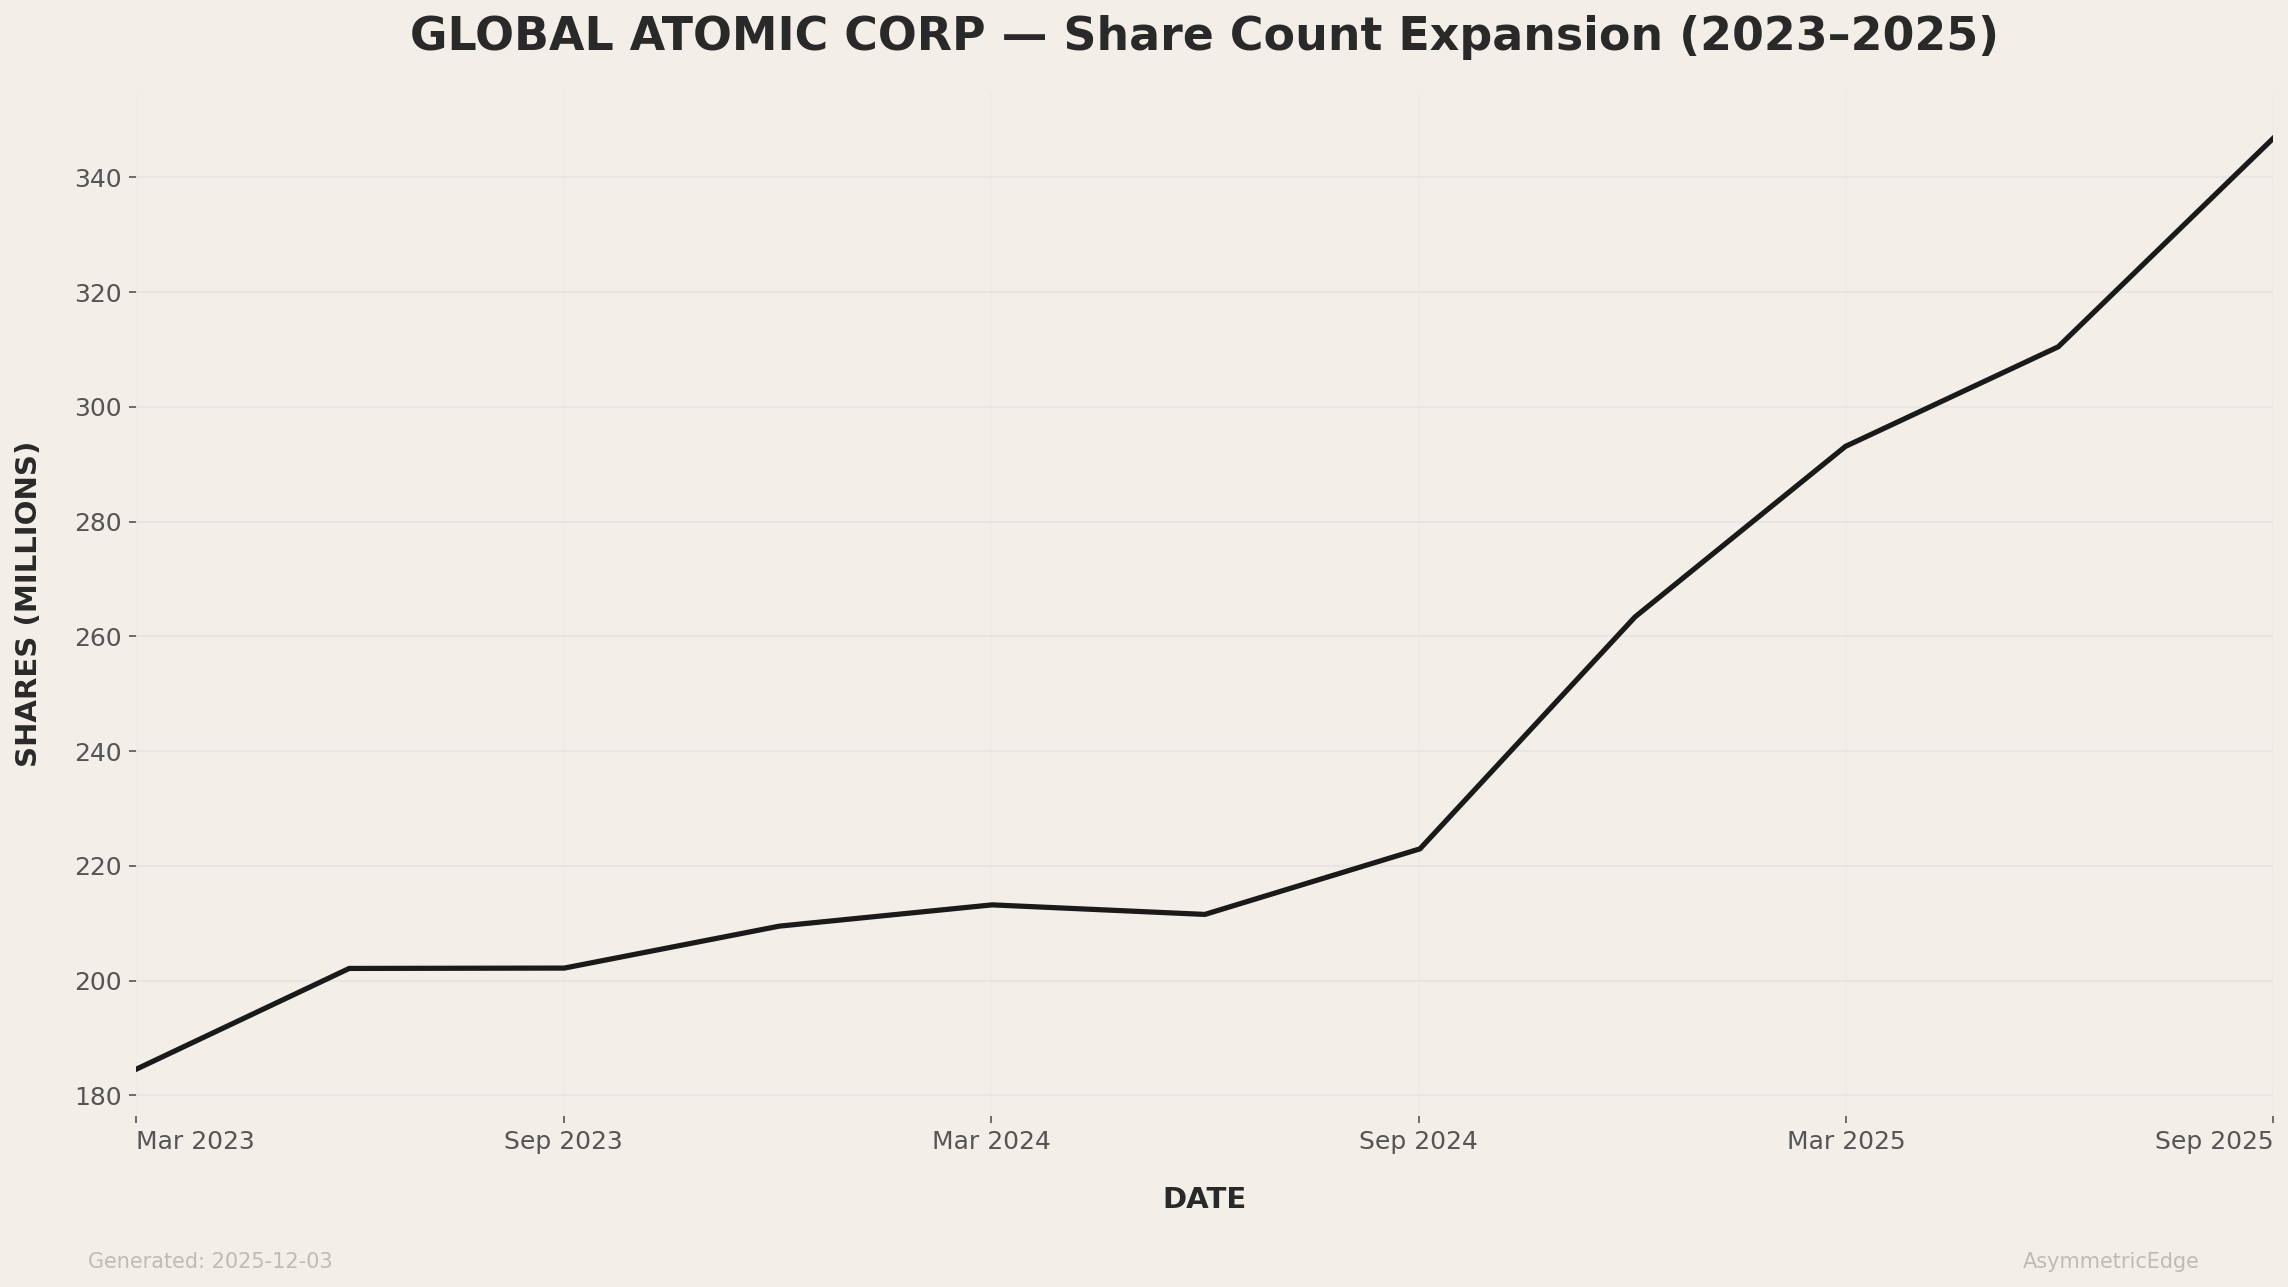
Because debt has not yet been finalized, Global Atomic raised more than C$100M in equity during 2025 — including a C$37.1M financing at C$0.62/share in October — to maintain construction momentum and support working capital. These raises were not part of the original sequencing but became necessary as construction advanced while lender due-diligence continued.
Until a project-finance facility is approved:
the project is not fully funded,
the construction schedule cannot be firmly locked in, and
dilution risk remains a key overhang on the stock.
Shares outstanding increased sharply in 2025 due to financing delays and equity raises as can be seen below:
Updated engineering work has increased remaining capital needs relative to earlier studies. A minority project-level JV remains a theoretical alternative funding pathway, though management continues to position a U.S. development-finance facility as the preferred financing route.
Bottom Line
The project is not yet fully funded, and the timing of external debt approval remains the primary gating factor. Until a binding financing package is secured, equity dilution risk persists and the construction timeline cannot be fully confirmed. This remains the core financial uncertainty in the investment case.
2.3 Uranium Market & Offtake Agreements
The broader uranium market remains one of the strongest tailwinds behind the Dasa project. While equity markets have focused heavily on Niger-related risks and financing delays, the fundamentals of the uranium sector have strengthened materially over the last two years. Long-term contracting has accelerated, term prices remain well above Dasa’s cost structure, and Western utilities have increased procurement as global supply chains realign.
Uranium Market Backdrop
Over the past decade, uranium supply has consistently lagged reactor demand, creating a structural deficit of roughly 60–70 million pounds per year. Supply from Kazakhstan and Russia — historically dominant — has faced growing geopolitical constraints, prompting U.S. and EU utilities to diversify contracting sources.
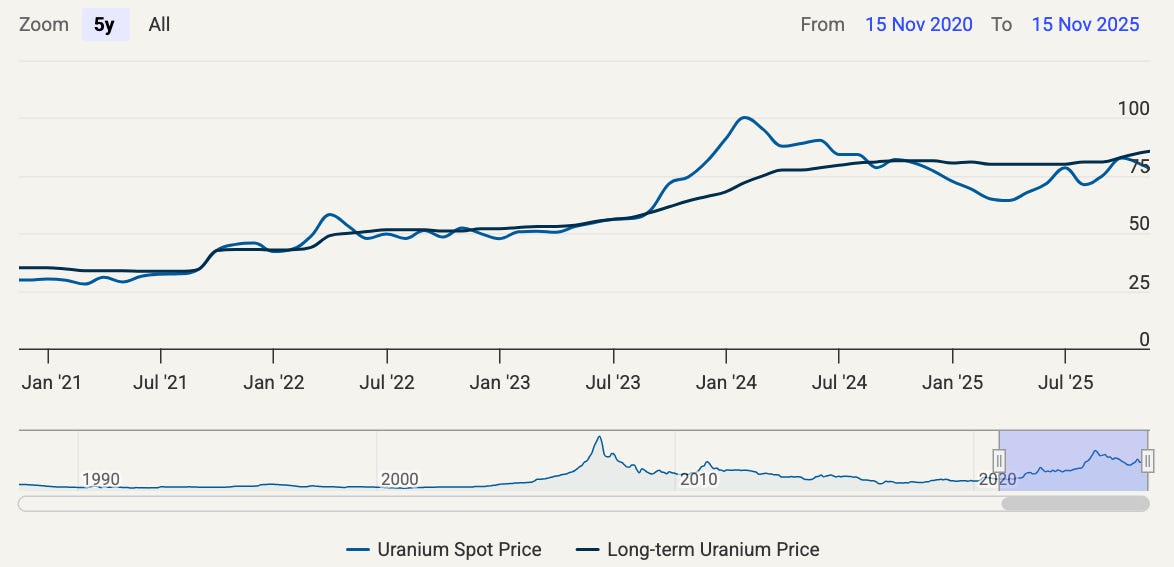
Long-term contracting volumes are now at their highest levels since the mid-2000s cycle. Utilities are securing supply at term prices in the US$70–80/lb range, which matters far more for a development-stage project than spot price volatility. Dasa’s cost structure sits well below these levels, supporting strong margins in most pricing environments.
Why two uranium prices exist — and why only one matters for Dasa:
Uranium has a highly volatile spot price driven by thin, trader-dominated volumes, and a far more stable long-term contract price that reflects real utility procurement. Most uranium is sold under multi-year contracts, not on the spot market, and this is the price benchmark lenders rely on in project finance.
Because Dasa will secure the majority of its production under long-term agreements, its economics and financing viability hinge on the long-term contract price — not on day-to-day spot fluctuations.
Key sector realities:
Long-term prices remain strong and stable
Contracting volumes have accelerated to decade highs
Western utilities are diversifying away from Russia/Kazakhstan dependence
Supply deficits persist across most forecast periods
These market dynamics provide a supportive backdrop for new low-cost development projects
Offtake Agreements
Global Atomic has already taken initial steps toward commercializing production. While much of the output remains uncontracted — typical for a pre-financing project — the company does have early commitments that indicate utility confidence.
These include:
A multi-year supply agreement with a European utility for initial production volumes
U.S. utility deliveries awarded via a competitive RFP (≈700,000 lbs over several years)
These offtakes cover a minority of the production assumed in the current Feasibility Study, leaving the majority uncommitted — strategically useful. Once financing is finalized, GLO will be negotiating from a stronger position, with potential for higher floors and better pricing structures.
The fact that utilities are willing to sign at all — despite geopolitical headlines — is a meaningful signal of confidence in Dasa’s underlying economics and development progress.
Bottom Line
The uranium market is not the constraint: long-term prices are strong, utilities are contracting aggressively, and early offtakes validate commercial demand. The real bottlenecks are financing timing, dilution risk, and execution in a frontier jurisdiction — not uranium fundamentals.
3) Project Economics
The 2024 Feasibility Study defines a long-life, high-grade underground operation with robust economics at conservative uranium prices. These are the key feasibility-study inputs used as the baseline for valuation. They reflect the deterministic engineering case only — before introducing Monte Carlo ranges or any optionality beyond the current mine plan. The numbers are taken from the “NI 43-101, Feasibility Study - Dasa Uranium Project”.
Mine Life: ~24 years
Ownership: 80% by GLO, 20% by the Republic of Niger
Recovered Production: ~68.1 Mlbs U₃O₈
AISC: ~US$35.7/lb (incl. royalties)
Total Capital Cost: US$647M (initial + sustaining over LOM)
Economics at ~US$75/lb U₃O₈:
NPV₈ (after tax): US$917M
IRR: 57%
Payback: ≈2.2 from start of production
4) Modelling Approach
Mining projects are not single-number forecasts — they are probability distributions disguised as spreadsheets.
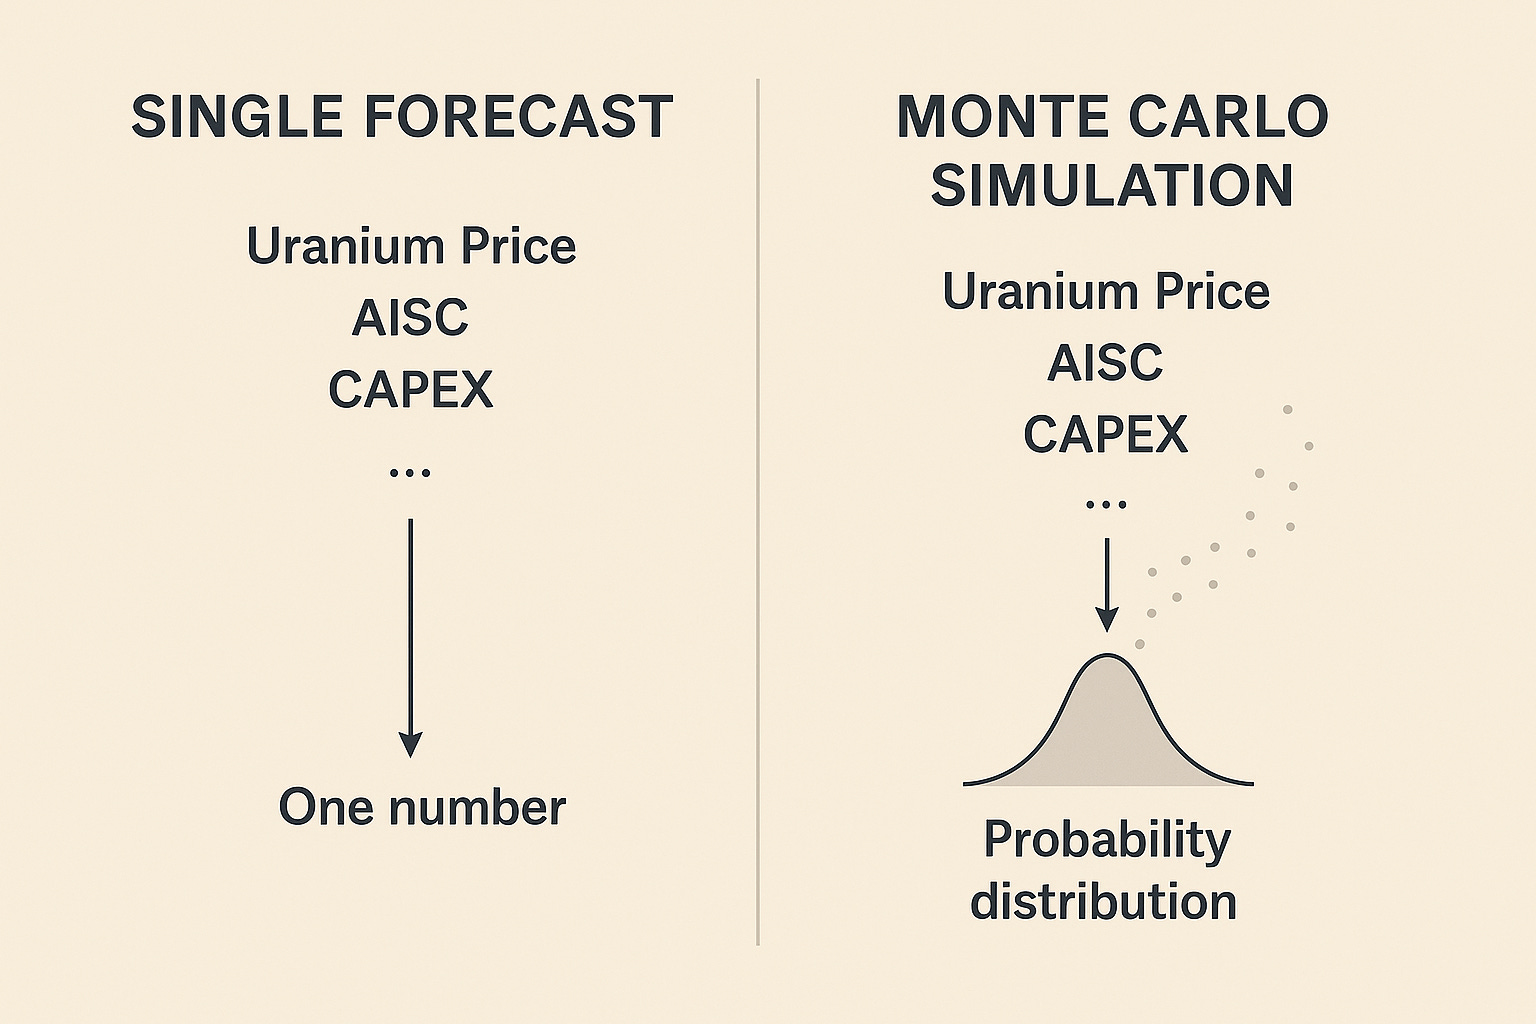
A traditional DCF (Discounted Cash Flow) Analysis uses one fixed set of inputs to produce a single valuation. In reality, every one of these inputs moves, and the valuation depends on how they interact.
A Monte Carlo simulation solves this by randomizing key inputs within realistic ranges and running the model thousands of times to observe the full distribution of outcomes. The goal is not to find “the true value,” but to understand the range of plausible values and how frequently each one occurs.
What the simulation did
I ran 10,000 iterations, each varying:
Mine recovery and production factors (operational performance)
CAPEX (initial + sustaining overruns)
AISC (operating cost variability)
Uranium price (spot + long-term contract factor)
Sales mix between long-term contracts and spot (pricing exposure)
Interest rate (debt-repayment sensitivity)
Equity gap → share dilution (funding shortfall)
Project-success variable (0 or 1) — probability the project is never built
What this produces
NPV distribution — the full range of project values across all scenarios
Upside distribution (conditional on success) — outcomes assuming the mine is successfully built
Upside distribution (including failure probability) — outcomes after incorporating the chance of total project failure
EV/NPV distribution — where the current market valuation sits relative to intrinsic value
Minimum DSCR distribution — how easily the project could service its debt in downside cases
For consistency across all Monte Carlo iterations, the valuation uses a 12% discount rate, which reflects a higher-risk jurisdiction and typical development-stage project financing conditions. This is separate from the Feasibility Study’s base-case NPV₈ and is used only for the simulation.
5) Key Results
The charts below summarize the core outputs of the simulation, moving from share-level upside to project-level economics and financing risk.
5.1 Share Upside Distribution (Success Only)
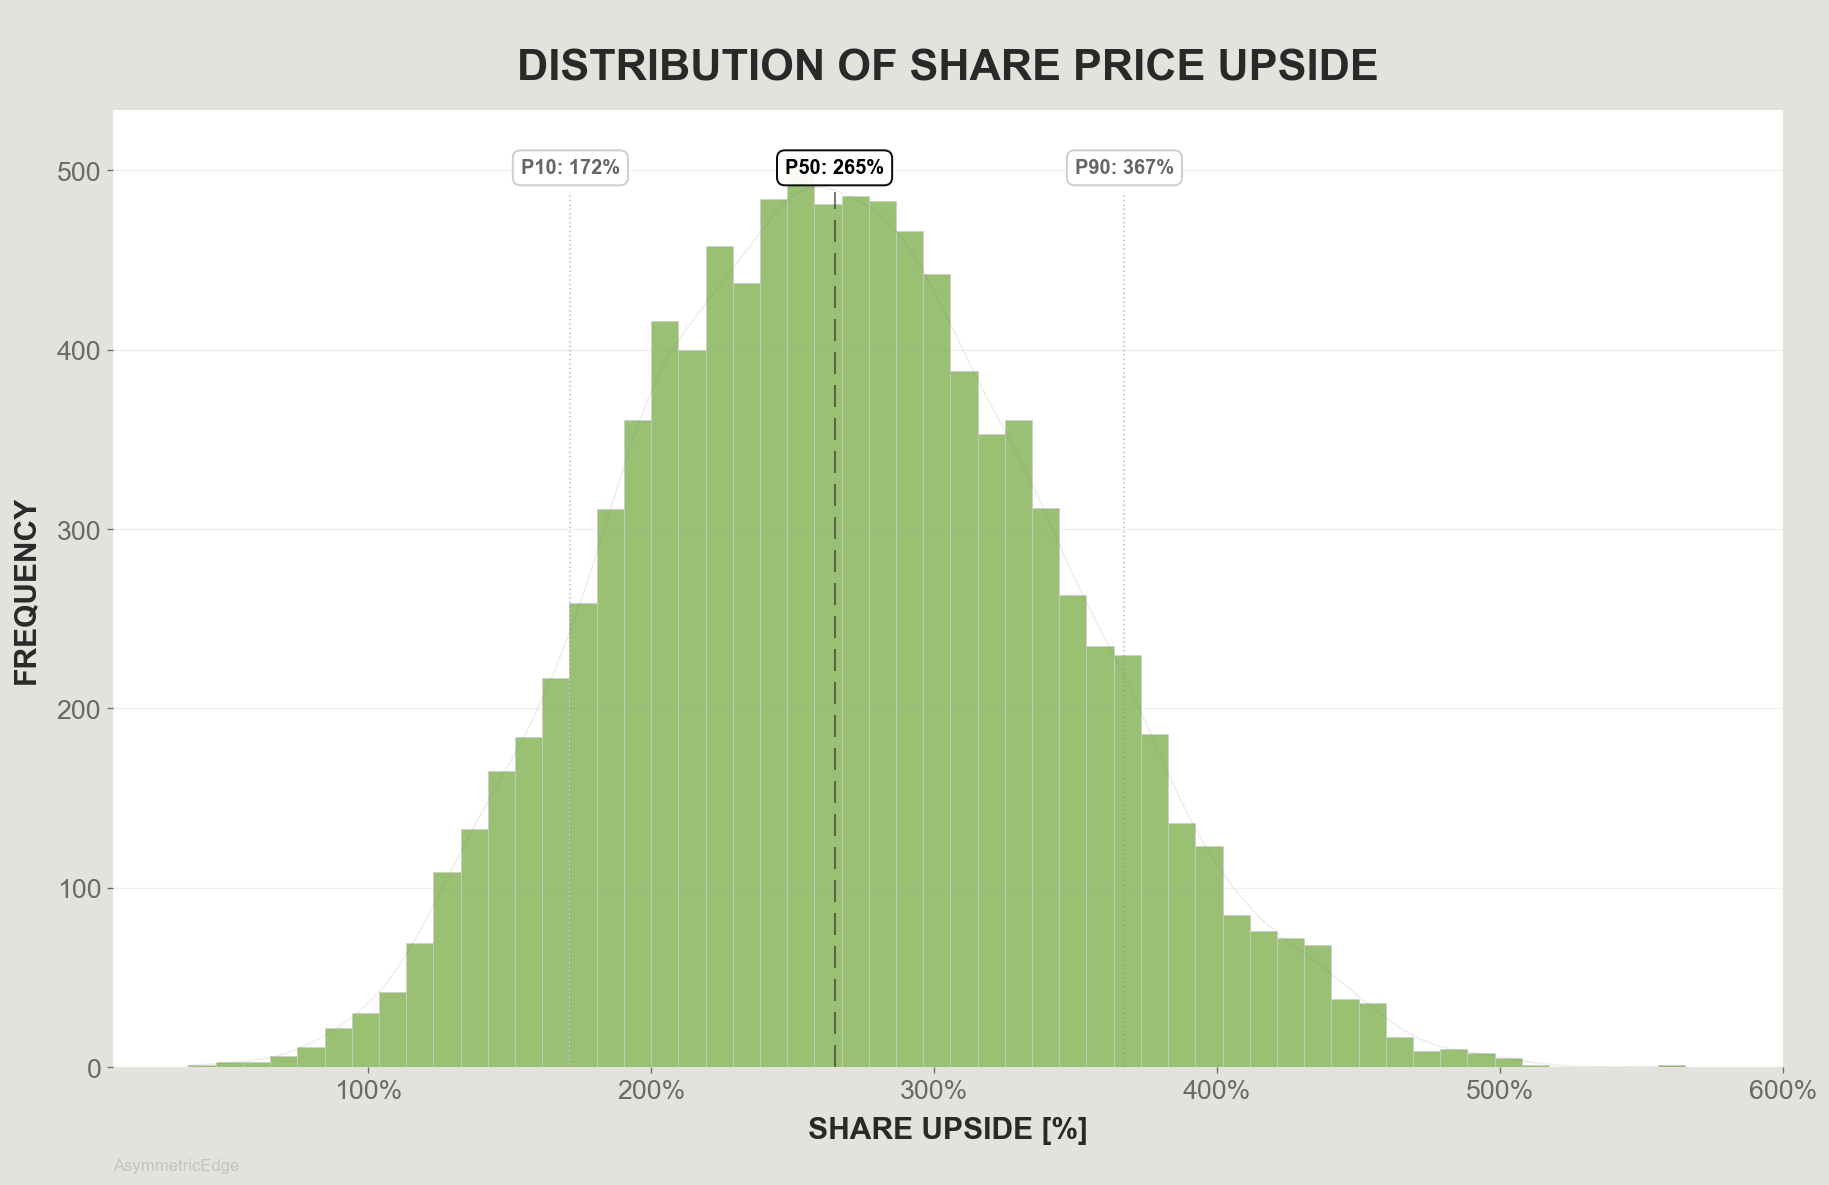
This chart isolates only the scenarios in which the project is successfully financed and built. It reflects share-price outcomes after incorporating financing-related dilution and Global Atomic’s 80% project ownership.
What it shows:
a stable distribution of upside outcomes
P10 (~172%) and P90 (~367%) significantly above current market pricing
all modeled upside remains positive in success-only scenarios
Interpretation:
Under the assumption that the project is successfully financed and built, the model produces a wide range of positive equity outcomes.
This distribution represents:
execution variability
commodity-price variability
CAPEX / AISC uncertainty
financing-related dilution
It does not incorporate completion risk — the left-tail (failure scenarios) is excluded here by design.
Accordingly, what this chart conveys is that conditional on successful development, the project’s economics support a substantial range of positive share-price outcomes, even after applying dilution and Global Atomic’s 80% project interest.
5.2 Share Upside Distribution (Including Failure Probability)
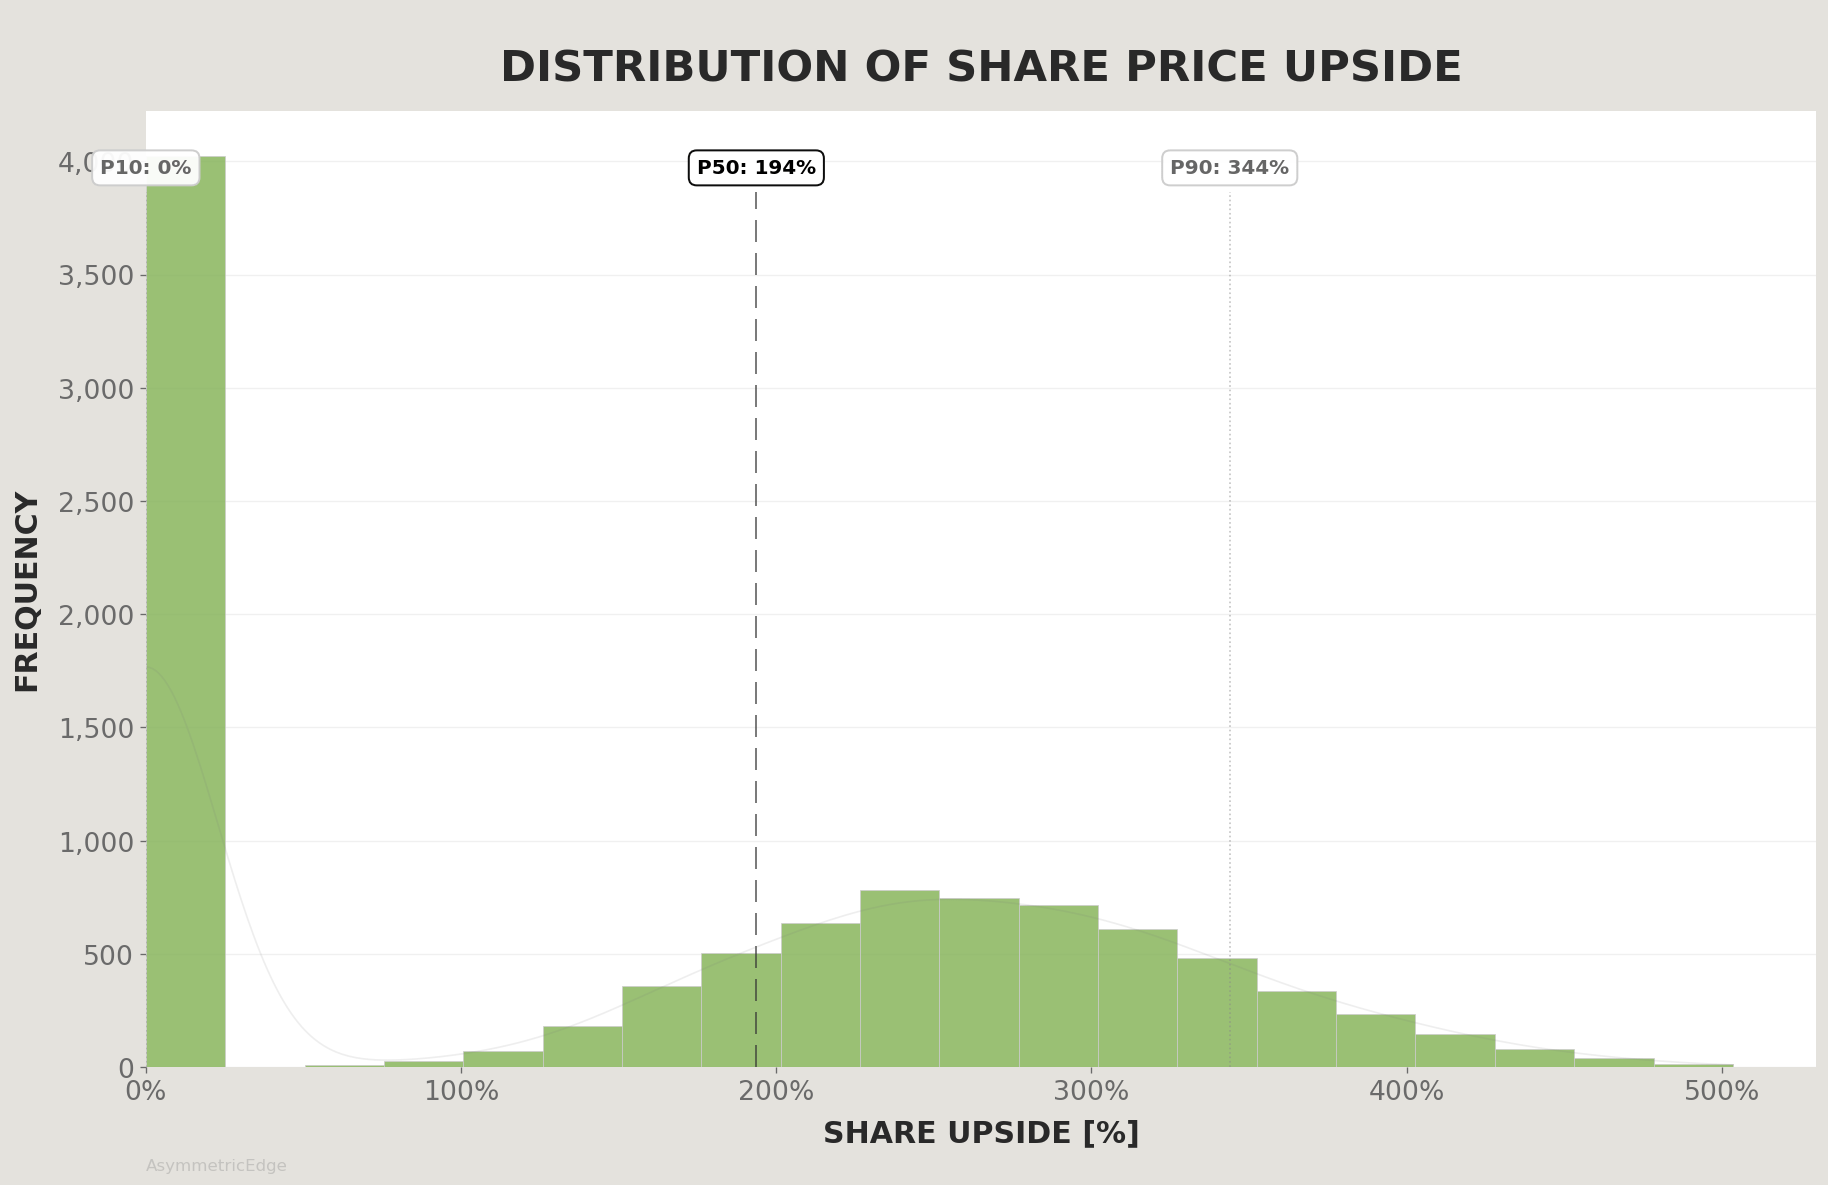
This is the realistic, all-in distribution, incorporating both successful and unsuccessful development outcomes. It combines:
scenarios in which the project is successfully financed and built
scenarios in which it does not advance to full construction
What it shows:
a large cluster at 0%, corresponding to the 40% of simulations where the project does not proceed
a smooth distribution of positive outcomes (P50 ≈ +194%, P90 ≈ +344%) across all successful build scenarios
Assumptions used in this model:
For this analysis, I apply a 40% probability of non-completion.
This reflects:
uncertainty around the timing of the US$295M debt facility
Niger’s political transition and prolonged lender due-diligence cycles
execution and sequencing risk during the construction phase
the typical risk profile of single-asset developers in emerging jurisdictions
This probability is not a prediction — it is a scenario assumption that helps illustrate how the market may be pricing project risk today.
Interpretation:
This distribution highlights how equity value is shaped by both project economics and completion probability.
Under a 40% non-completion assumption:
the median outcome (~+194%) still exceeds today’s share price, suggesting that the market may be implicitly assigning an even higher completion-failure probability than 40%, or demanding a substantial risk premium for timing, financing, and jurisdictional uncertainty.
In other words, the valuation gap is driven less by the quality of the deposit and more by the uncertainty surrounding the path to production.
5.3 NPV Distribution
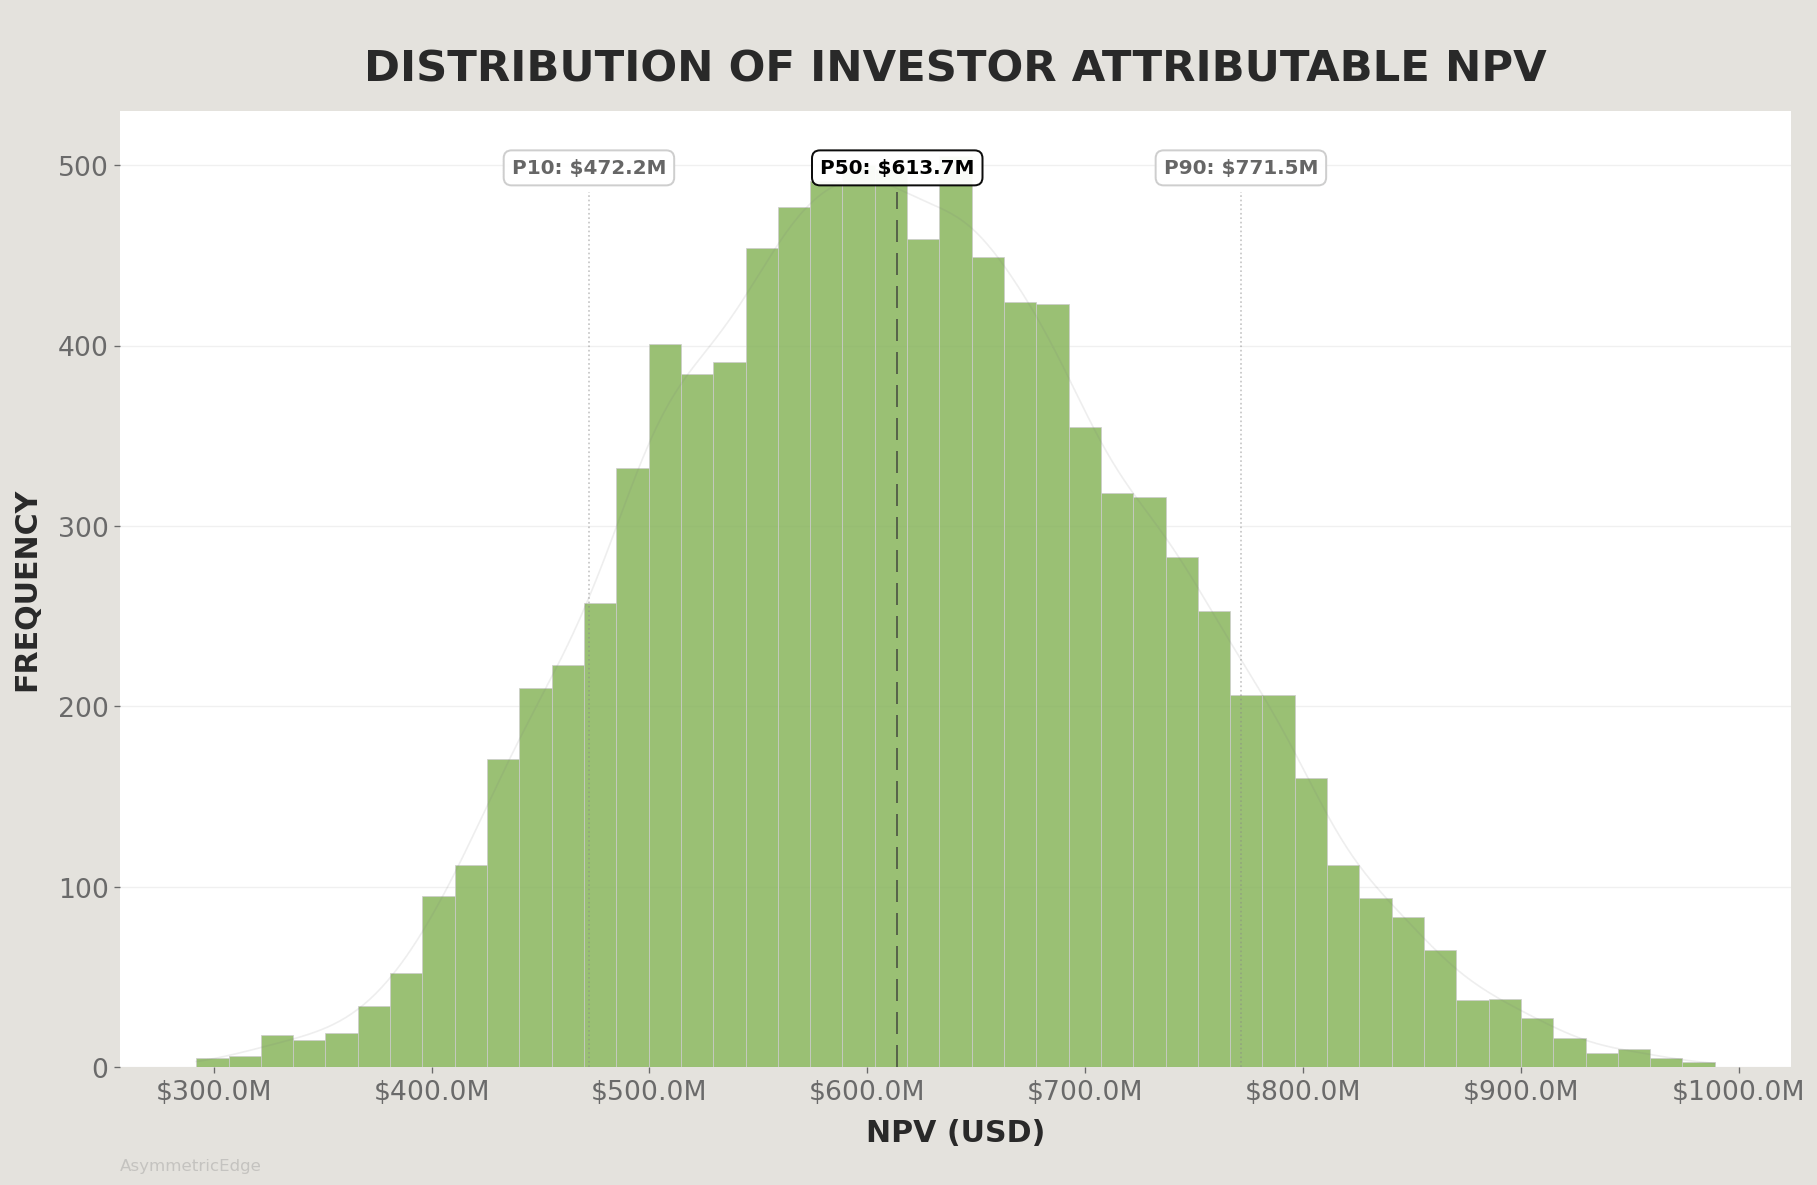
This distribution reflects Global Atomic’s attributable share of project value (80% ownership of Dasa), rather than the full project-level NPV. It excludes previously incurred capital and does not incorporate future equity dilution — it represents the underlying economic value flowing to GLO’s interest in the project, conditional on successful completion.
What it shows:
NPV is positive in the majority of simulated outcomes.
The downside tail is driven primarily by CAPEX overruns and lower uranium pricing.
The right tail expands under higher uranium-price scenarios, reflecting significant leverage to price.
Interpretation:
Across a wide range of plausible cost and pricing environments, the project generates positive economic value attributable to Global Atomic in most modeled scenarios.
This chart does not incorporate completion risk or equity dilution — only the underlying economics if the project is built and operates as modeled.
5.4 EV/NPV Distribution
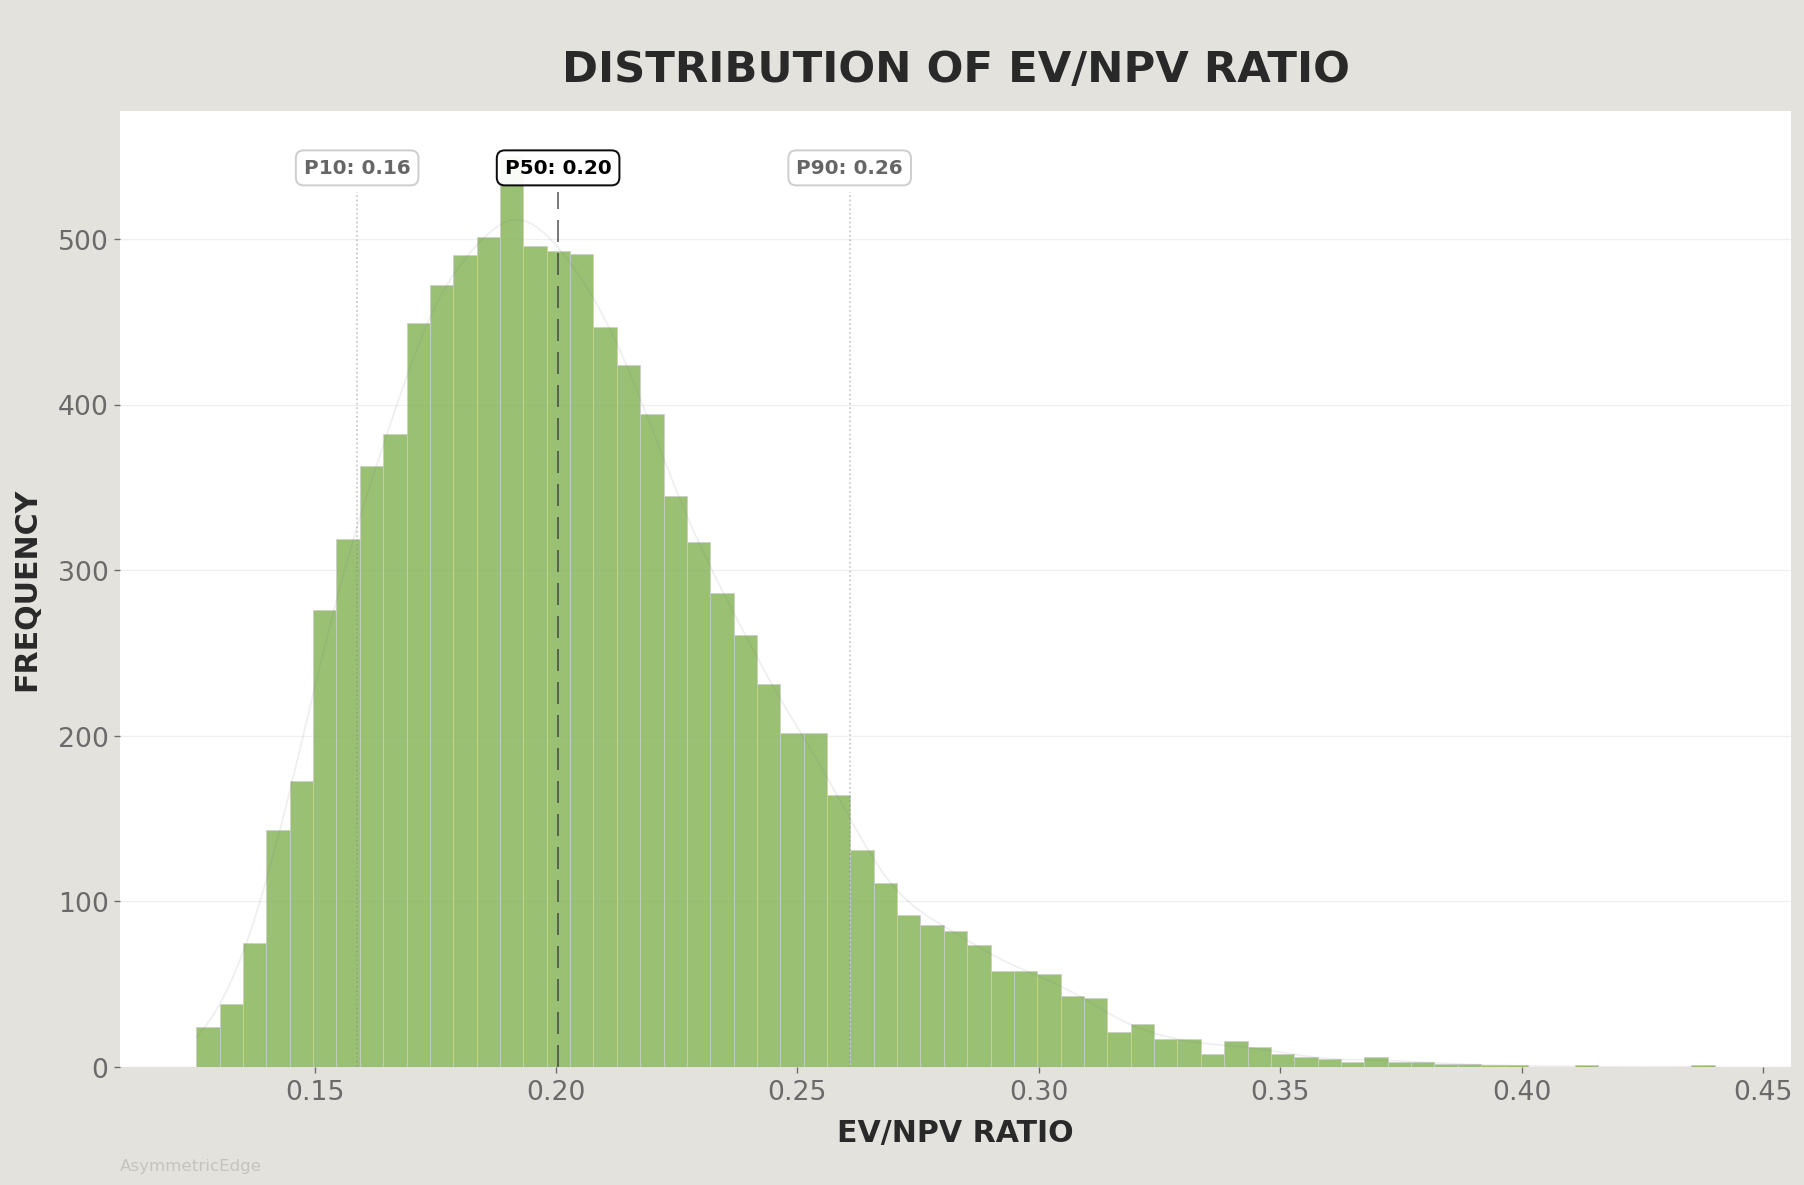
This chart shows the distribution of simulated EV/NPV outcomes using the current enterprise value and a variable NPV drawn from the Monte Carlo model.
What it shows:
A range of EV/NPV outcomes driven entirely by uncertainty in uranium pricing, operating costs, CAPEX, and recovery assumptions.
A median EV/NPV around ~0.20, which is typical for development-stage mining projects facing financing, sequencing, and jurisdictional risk.
Interpretation:
The distribution highlights how Global Atomic’s valuation compares to its simulated intrinsic value under a wide range of technical and market conditions. At this stage of the project — pre-financing, under a transitional government, and without full cost certainty — lower EV/NPV ratios are not unusual.
By contrast, fully financed, de-risked uranium developers often trade closer to 0.8–1.0× EV/NPV, reflecting substantially reduced uncertainty around capital costs, permitting, and the path to production. The gap illustrates how much of Global Atomic’s current valuation discount can be attributed to development-stage and jurisdictional factors rather than project economics alone.
5.5 Minimum DSCR Distribution
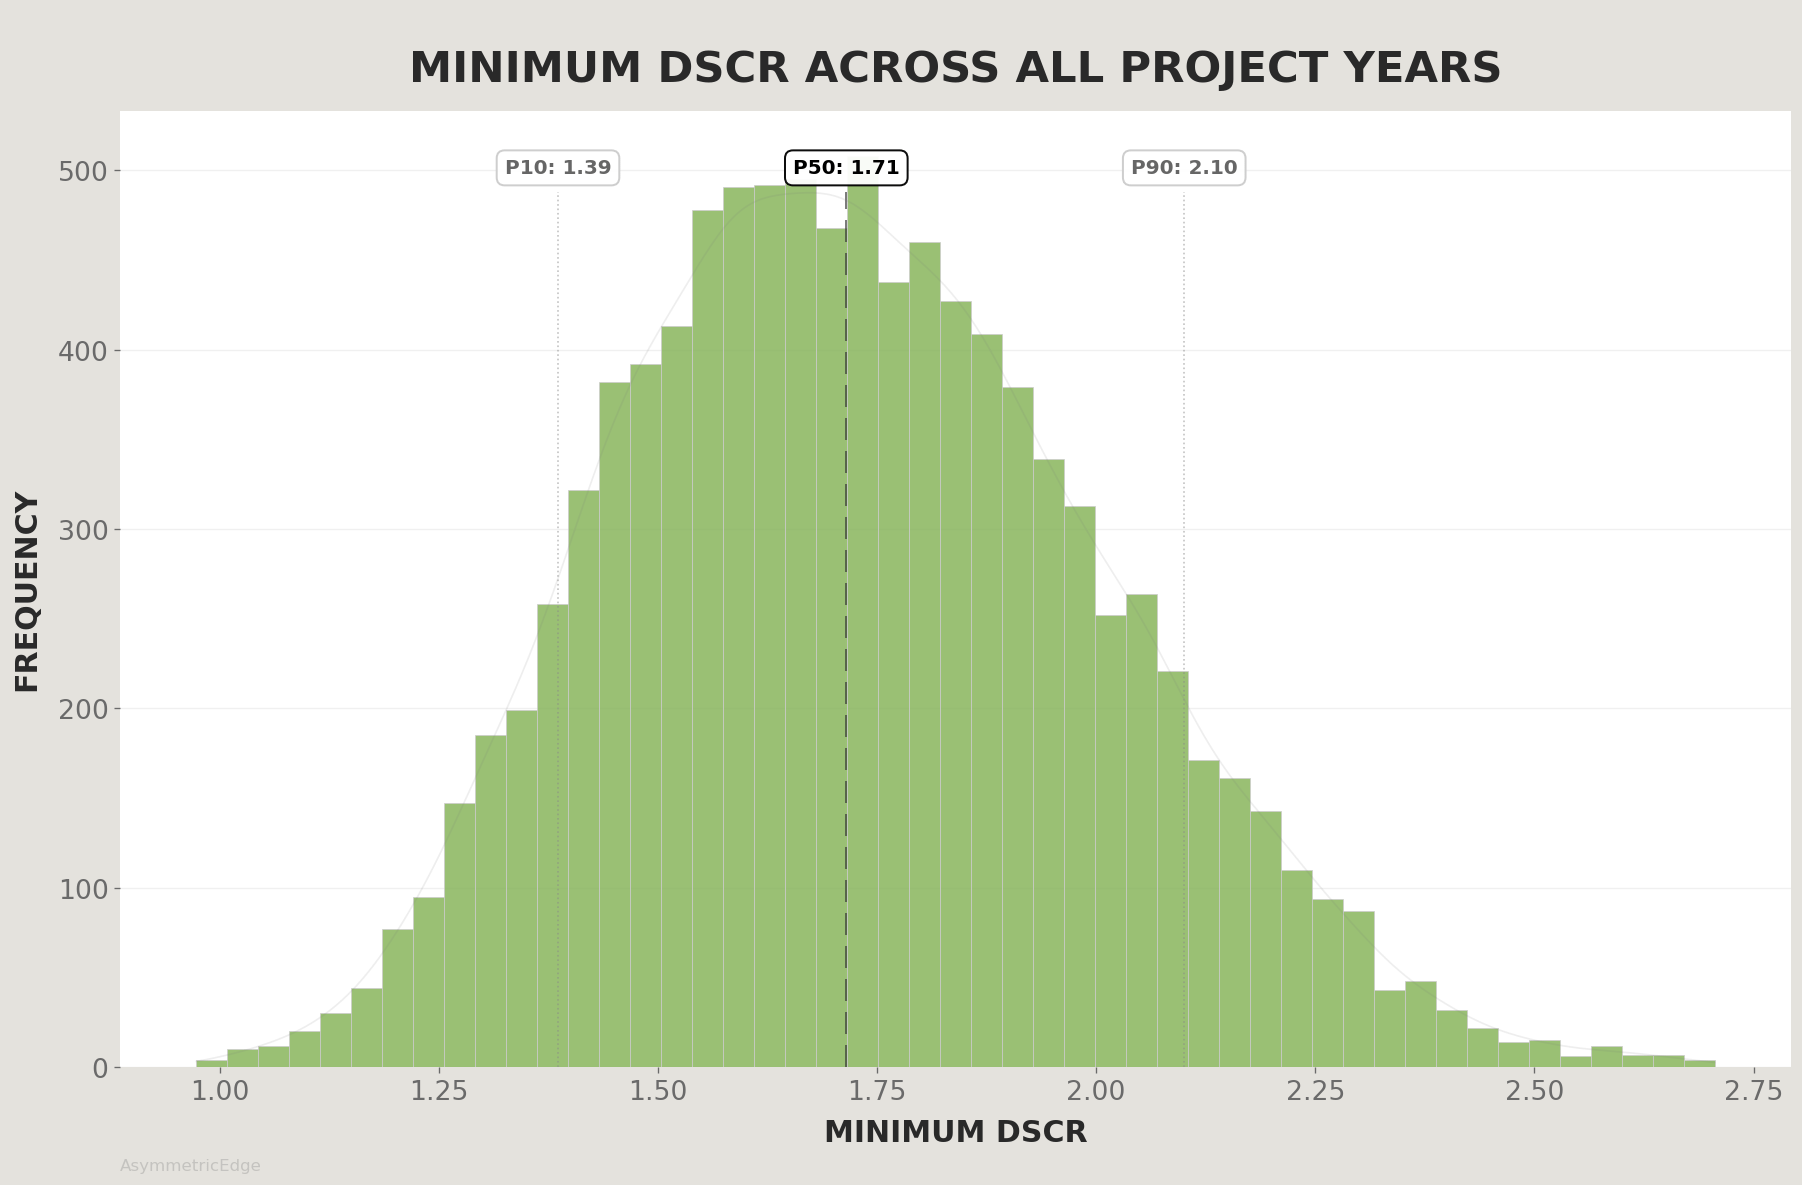
Debt Service Coverage Ratio (DSCR) is a core metric in project finance, measuring how comfortably operating cash flow can cover scheduled debt repayments. This chart shows the minimum DSCR achieved during the full debt-service period — the figure lenders focus on when assessing a project’s resilience under stress.
What it shows:
in most simulated operating paths, minimum DSCR remains at levels generally considered financeable
a minority of scenarios fall below thresholds such as 1.2× or 1.0×, usually driven by higher capital intensity or weaker uranium prices
these lower-coverage cases help explain why lenders apply extensive stress testing and progress cautiously during due diligence
Interpretation:
The distribution highlights that while many simulated outcomes support adequate debt coverage once the plant is running, some paths fall into ranges that warrant closer lender scrutiny. This reflects typical project-finance dynamics at the development stage, where uncertainties in cost, pricing, and ramp-up performance contribute to a spread of potential coverage outcomes.
5.6 Contextual Note — How Developers Have Traded in Past Uranium Cycles
The Monte Carlo outputs above show Dasa’s economic value under thousands of simulated scenarios.
However, they reflect only project-level economics—not how the market may value a de-risked project during periods of strong uranium demand.
In previous uranium cycles, advanced-stage developers have at times traded at significant premiums to project NPV, particularly during periods of tight contracting and limited new supply. Historical sector data from the 2005–2007 cycle and parts of 2021–2022 show developers reaching:
2–3× EV/NPV during intense contracting cycles
temporary valuation premiums driven by supply shortages and strong utility demand
None of these historical multiples are included in the model.
The Monte Carlo framework reflects only Dasa’s fundamental economics, without applying any market-cycle re-rating or premium-to-NPV assumptions.
This distinction is important:
The charts show economic value. They do not attempt to simulate how the market might value that economic value during different phases of a uranium cycle.
6) What the Charts Actually Say About GLO
Taken together — the share-upside distributions, the NPV range, the EV/NPV ratios, and the DSCR stress tests — the Monte Carlo outputs paint a consistent picture. Dasa’s underlying economics are strong across most modeled operating and pricing environments. Even under conservative assumptions, the investor-attributable NPV sits well above Global Atomic’s current enterprise value.
Where the distributions widen is not in the project economics, but in the probability of successful completion.
The two share-upside curves illustrate this clearly:
the success-only distribution shows a wide range of positive outcomes once the project is financed and built
the all-in distribution — which incorporates a 40% non-completion assumption — produces a large left-side cluster at 0%, reflecting financing and jurisdictional uncertainty rather than poor project economics
The DSCR distribution reinforces the same message: most operating paths comfortably support debt repayment once the plant is running, but the downside tail requires lender scrutiny — typical for a development-stage project in a frontier jurisdiction.
The core insight
The market appears to be pricing execution and timing uncertainty, not questioning the geological or economic quality of the Dasa orebody. If the project advances to full construction, the valuation gap implied by the success-only outcomes is large. If it does not, the current pricing is understandable.
In other words: valuation is being driven by perceived probability of completion — not by doubts about the project’s intrinsic value.
7) What the Market Is Likely Pricing In
While the Monte Carlo analysis highlights strong project economics with completion risk as the main variable, the market prices a broader set of uncertainties — many of which lie outside the model and relate to investor behavior, capital flows, and jurisdictional context.
Several structural factors appear to drive today’s valuation:
1. Funding-sequence opacity
Investors lack visibility on:
the final structure of the US$295M debt facility
timing of commitment
the scale and pricing of any remaining equity component
Markets rarely give credit for value until financing is locked and sequenced.
2. Timing drift and project-level inertia
Even if economics are strong, repeated shifts in expected timelines trigger a “delay discount” — especially for single-asset frontier developers.
This is separate from completion probability; it is about friction and time-value erosion.
3. Dilution overhang
The 2025 equity raises signaled that the funding pathway is not yet linear.
For pre-production miners, investors often assume future raises until proven otherwise, magnifying the discount rate applied to the equity.
4. Jurisdictional and governance risk premium
Regardless of project quality, financing in Niger requires:
lender comfort with political stability
additional legal and sovereign-risk review
risk-adjusted hurdle rates above those in tier-1 jurisdictions
This premium is structural — it persists even when project economics are robust.
5. Lack of portfolio diversification
As a single-asset developer, Global Atomic cannot buffer:
cost surprises
scheduling deviations
geopolitical shocks
commodity volatility
This amplifies perceived risk because any issue affects the entire equity.
6. The ownership structure of the stock
The current shareholder base is dominated by:
retail investors
small-cap funds
passive uranium ETFs
Active institutional capital generally enters only after:
financing is fully secured
construction is visibly progressing
political and permitting frameworks stabilize
Until then, valuation is set by investors who de-risk early and aggressively.
8) What Could Reduce Uncertainty
Several milestones could materially improve market confidence in Dasa’s path to completion.
None require changes to the orebody — they are visibility and sequencing milestones.
1. Finalization of the Debt Facility
The single most important de-risking event.
A binding US$295M facility would reduce uncertainty around both schedule and equity dilution.
2. Updated Capital Guidance & Cost Stability
Clear confirmation of remaining CAPEX requirements would narrow:
dilution expectations
lender stress-case assumptions
market uncertainty about overruns
3. Government & Lender Confirmation Signals
Common de-risking markers in emerging-market project finance, including:
updated government approvals
completion of lender due diligence
visible steps toward construction mobilization
These signals typically precede formal financing approval.
4. Construction Milestones
Progress in:
plant installation
procurement
underground development
These all reduce perceived execution risk and timeline slippage.
5. Additional Offtake Agreements
More clarity on committed volumes and floor pricing strengthens revenue visibility and lender comfort.
9) Conclusion
The Monte Carlo simulation reframes Dasa not as a single forecast, but as a probability-weighted landscape of possible outcomes. Across thousands of scenarios, the project’s underlying economics remain consistently strong — yet the distributions also show a meaningful set of cases where financing or jurisdictional uncertainty prevents timely completion.
These two forces define today’s valuation:
strong intrinsic project economics, and
non-trivial completion risk tied to financing, sequencing, and jurisdiction.
The model does not attempt to predict which path will occur.
Instead, it quantifies how much value is associated with each possible outcome.
If the project advances to full construction, the distribution of successful-case outcomes implies materially higher equity value. If it does not, the value impairment is substantial.
This is the probability landscape the market is navigating — not a judgment on Dasa’s geological quality, but a reflection of the uncertainties that remain between feasibility and production.
Disclaimer
This analysis is for educational purposes only and reflects my interpretation of publicly available information and standard project-finance methodologies. It is not financial advice. Nothing in this article should be interpreted as a recommendation to buy or sell any security. All investors should conduct their own research and consider their own financial circumstances and risk tolerance before making investment decisions.