Is the AI trade over, or just repricing?
The first Free Letter follows a sharp selloff in semiconductors. The question is whether AI earnings expectations have weakened, or investors are paying less for forecasts that still hold.
The first Free Letter follows a sharp selloff in semiconductors. The question is whether AI earnings expectations have weakened, or investors are paying less for forecasts that still hold. This issue examines the market move, company estimates and valuations ahead of the next results.
1. The market
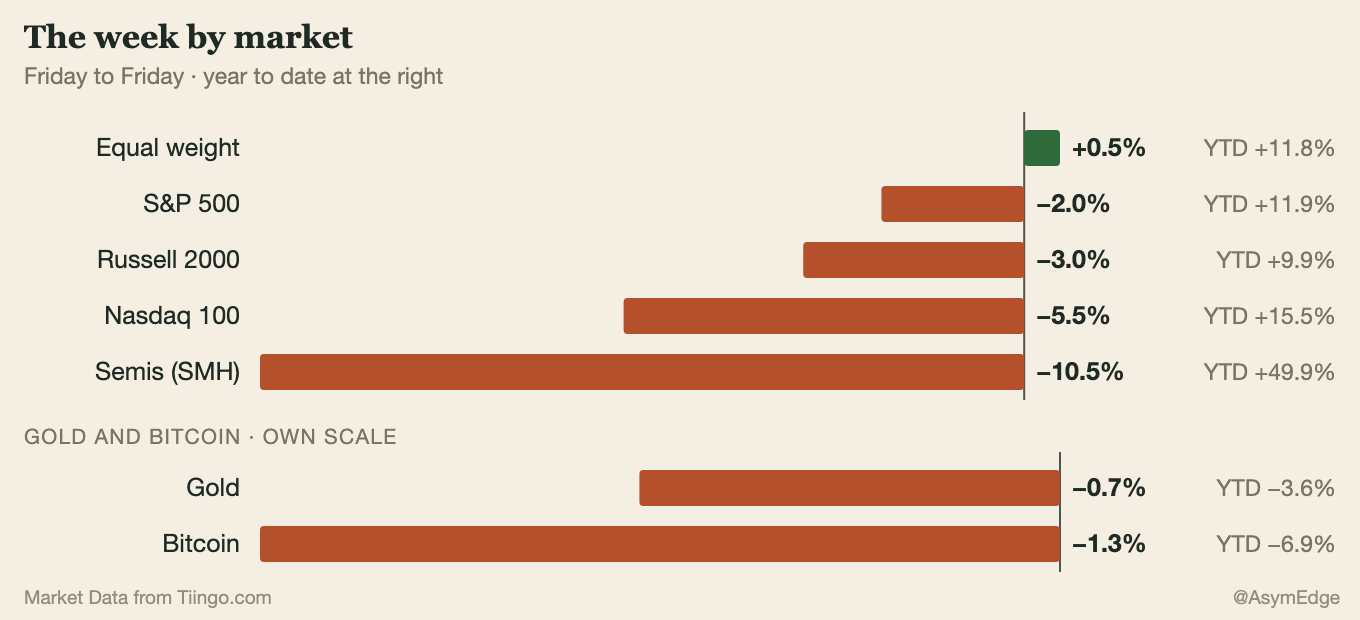
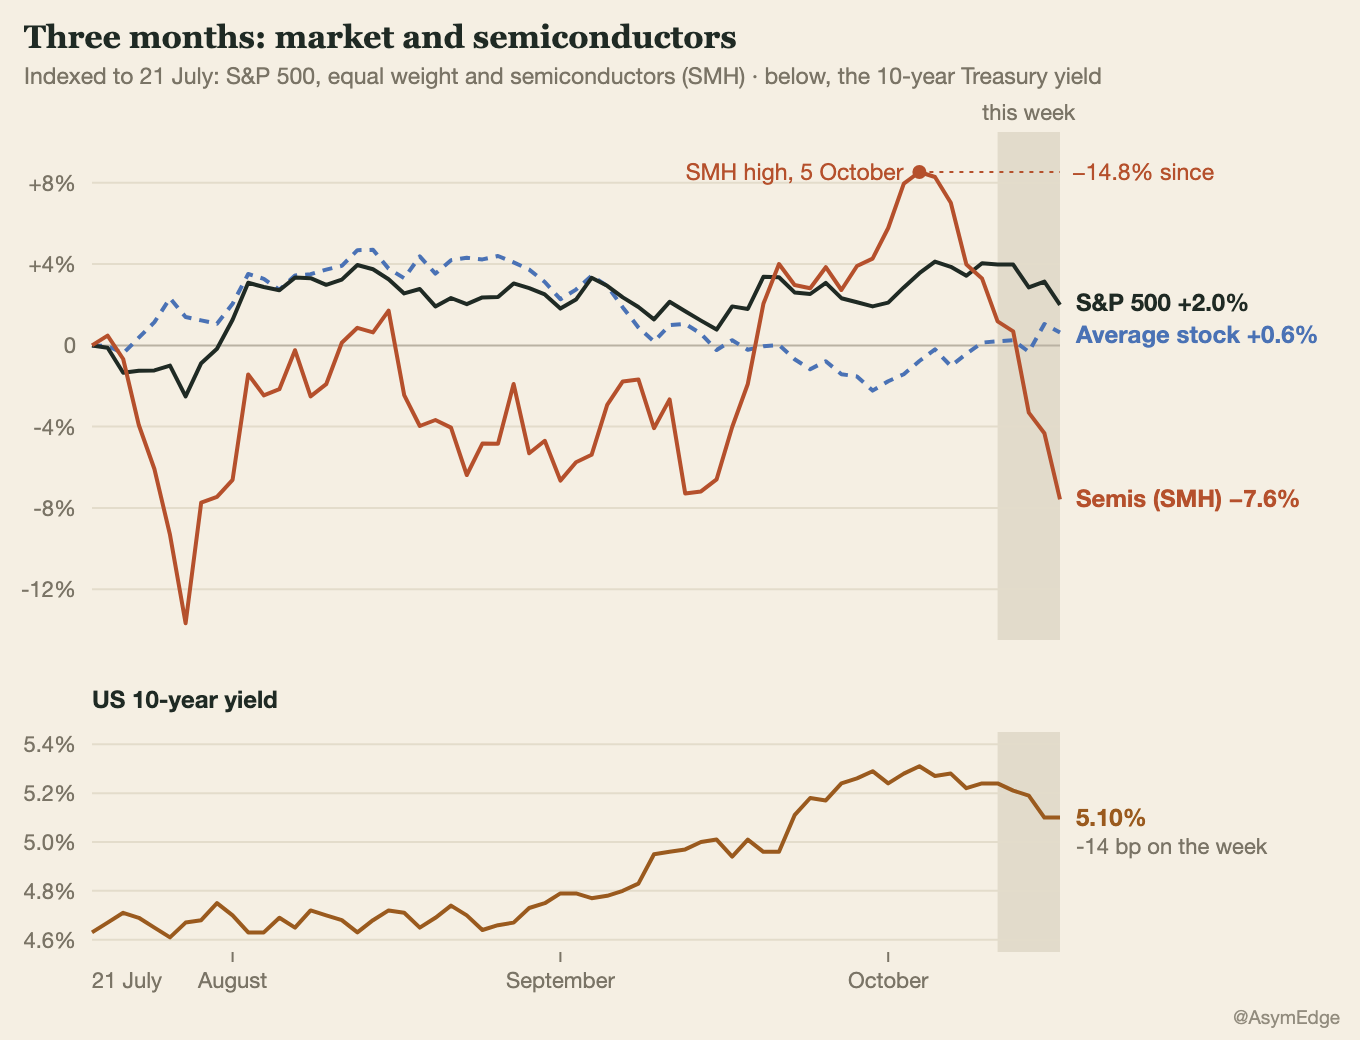
The week’s selloff was concentrated in chips and large growth stocks: the semiconductor ETF SMH fell 10.5% and the Nasdaq 100 lost 5.5%, while the equal-weight S&P 500 gained 0.5%. Investors appear to be questioning whether the AI buildout will earn enough to justify its cost. At an October 12 conference, Broadcom CEO Hock Tan said many companies had yet to see a return on AI spending and warned that financing could become the next bottleneck. September US consumer prices rose 0.6% and producer prices 1.3%; Brent crude ended the week at $109.86 a barrel, up 4.9%. These are plausible pressures, not proof of why investors sold.
Supplier results tell a different part of the story. ASML reported €11.7 billion of third-quarter sales and said customers had raised their equipment demand forecasts. TSMC reported $46.72 billion of quarterly revenue, up 41.2% year over year, and expects continued strong demand for leading-edge manufacturing. Demand for chipmaking equipment and advanced manufacturing remains strong. The open question is whether AI customers will earn enough to sustain investment at this pace. So far, the evidence points to a concentrated repricing of the AI trade rather than a broad break in chip demand.
Market state
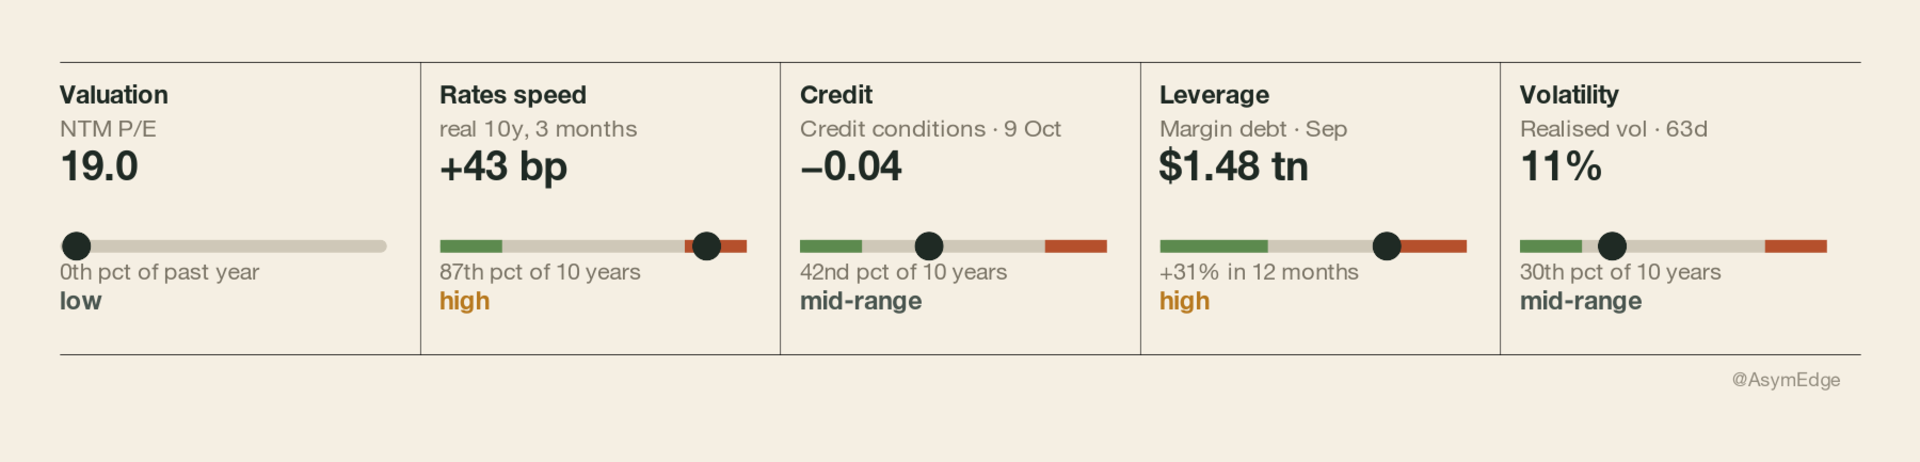
The S&P 500 trades at 19 times the earnings analysts expect over the next year, near the low end of its 2026 valuation range. Investors are paying less for each dollar of forecast profit than they have for most of this year. The coming results will show whether those profit forecasts hold up.
Other signals are mixed. The inflation-adjusted ten-year Treasury yield has risen 43 basis points in three months, and September margin borrowing reached $1.48 trillion, up 31% from a year earlier. Yet credit conditions remain near the middle of their ten-year range, and market volatility over the past 63 trading days is 11%. These gauges do not show a broad credit squeeze. Higher real yields and rising borrowing could make an earnings disappointment harder to absorb.
2. The Twelve
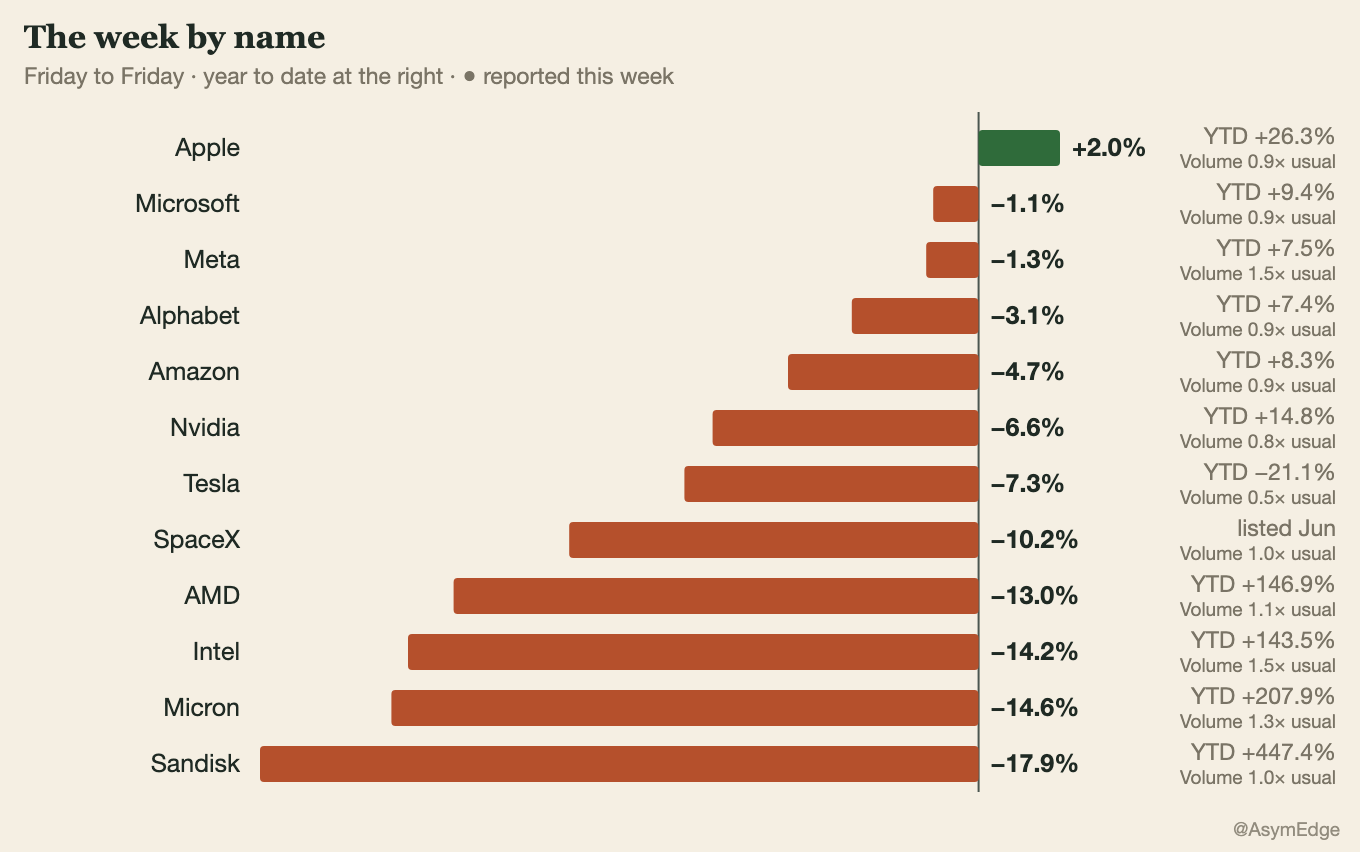
Eleven of the Twelve most traded US-listed stocks fell this week. Apple was the sole gainer, up 2.0%. The steepest losses were in Sandisk, Micron, Intel and AMD.
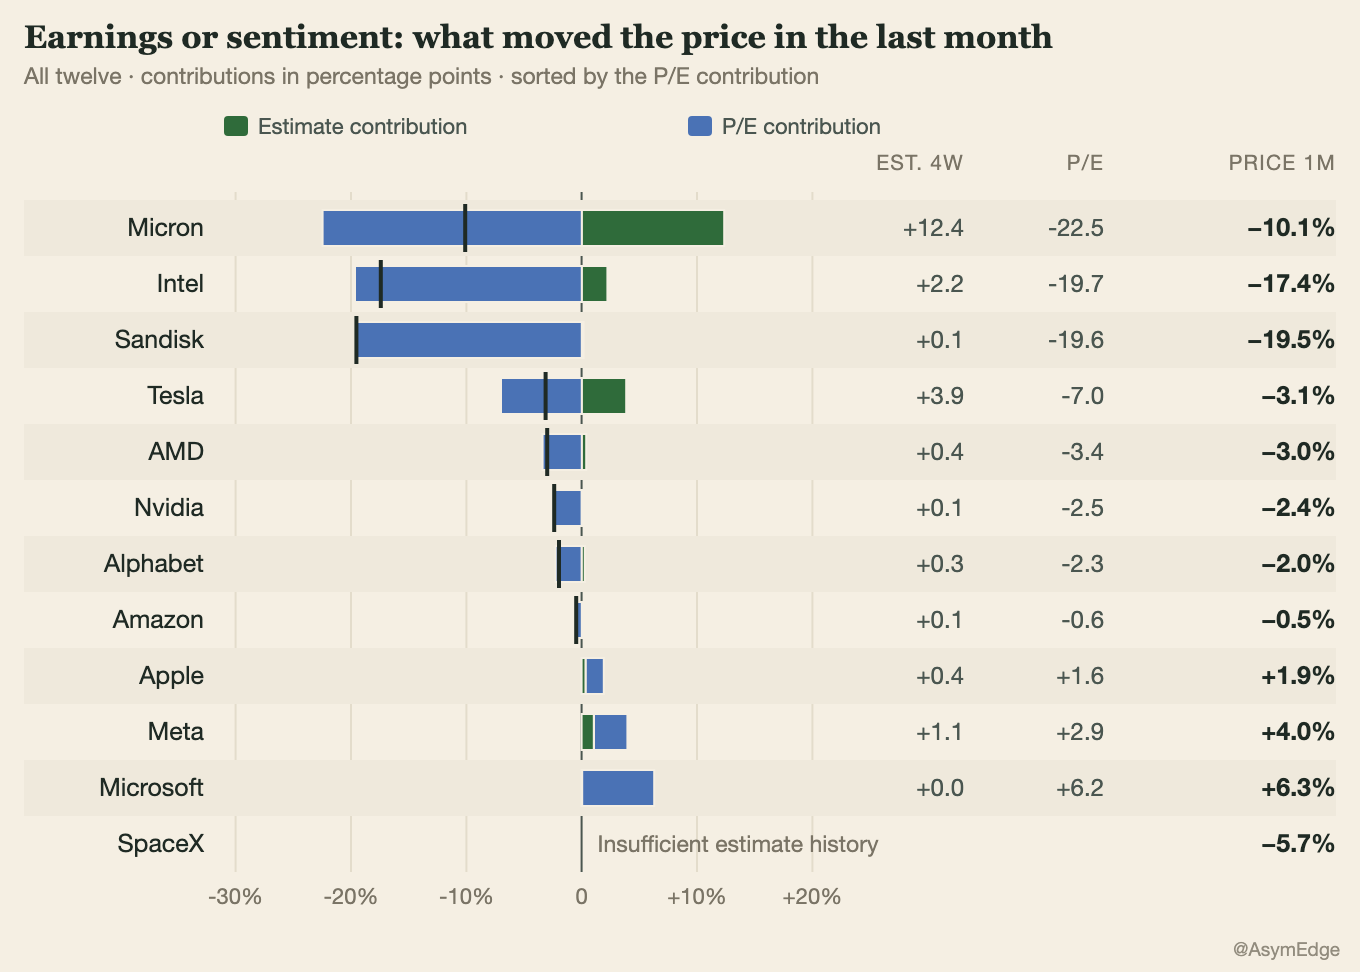
Micron is the clearest split between operating expectations and price: its shares fell 10.1% over the month while the four-week earnings-estimate contribution was positive 12.4 percentage points. The P/E contribution was negative 22.5 points. The market has marked down what it will pay for the improved forecast.
Sandisk fell 19.5% over the month with estimates nearly flat; Intel fell 17.4% despite a modest positive estimate move. NVIDIA slipped 2.4% on this monthly view with estimates nearly unchanged. These decompositions describe the move; they do not prove the forecasts will survive the next results.
3. The outlook
Read the map in two dimensions: higher means more expected earnings growth; further right means today’s forward P/E is further below its one-year median.
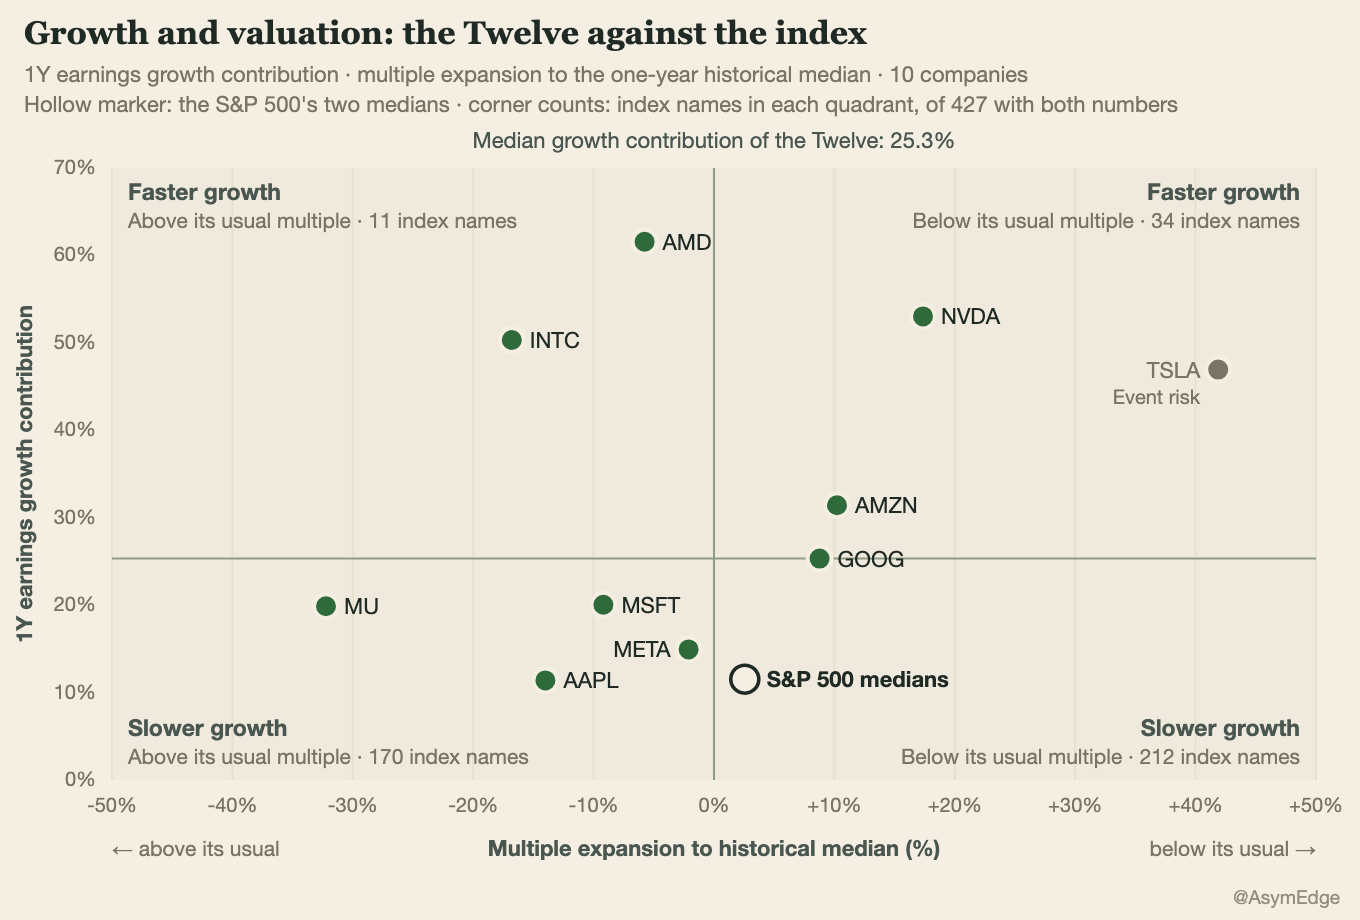
Sandisk and SpaceX remain in the Twelve; the one-year map comparisons are unavailable. Their available price and earnings figures appear elsewhere in the letter.
AMD, NVIDIA and Intel have the strongest forecast earnings growth on this map. AMD and Intel trade above their own one-year median forward P/Es, so a return to those medians would weigh on their shares even if earnings forecasts hold. NVIDIA, Amazon and Alphabet trade below their medians and would benefit from a recovery in those multiples. Whether any multiple returns to its old level depends on the earnings that follow.
Micron sits near 5.0 times NTM earnings with about 20% forecast growth, reflecting how little of the current profit level the market is willing to capitalise. Tesla appears to the right of its one-year median P/E, but that is only a relative comparison: its forward P/E is still about 154 times, and it carries SpaceX-related and regulatory event risk. Tesla is excluded from the historical P/E-range comparison and shown in grey as event risk on the price-scenario chart. Those scenarios are especially sensitive to the assumed multiple.
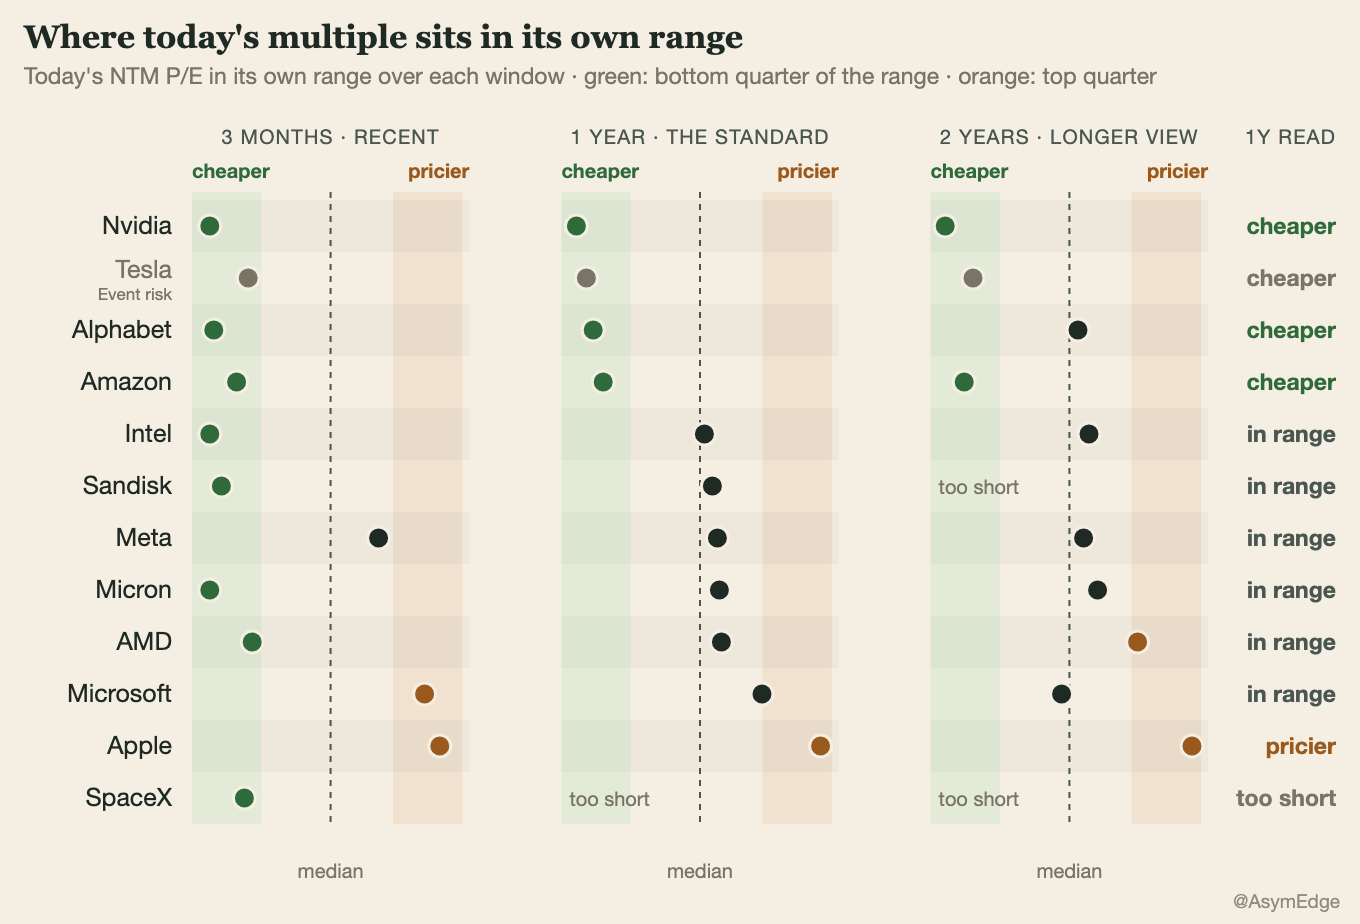
This chart shows where each stock’s forward P/E sits within its own three-month, one-year and two-year history. Three months captures the recent reset; one year is the main reference in this issue; two years tests whether the reading survives a longer period. The useful window depends on how much the business and its earnings base have changed. NVIDIA’s P/E is near the bottom of each available range: roughly the 2nd percentile over three months and below the 1st percentile over one and two years. Alphabet and Amazon also look cheaper against their recent histories; Apple’s multiple is toward the expensive end.
A low historical percentile is a starting point for research, not a price target. Sandisk has too little history for a two-year comparison, and SpaceX has only a short trading record. A changed earnings base can also make an older P/E reference less useful.
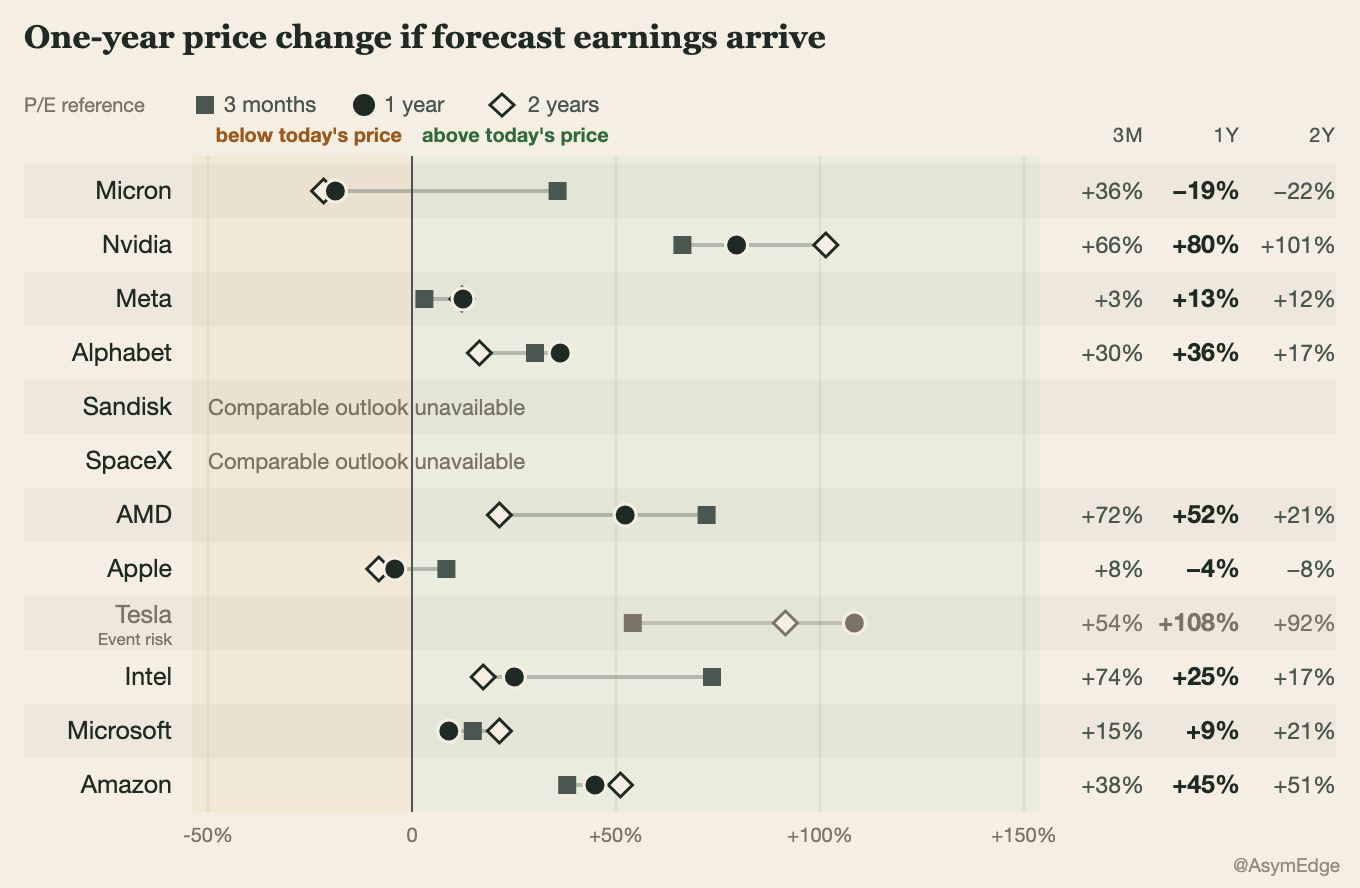
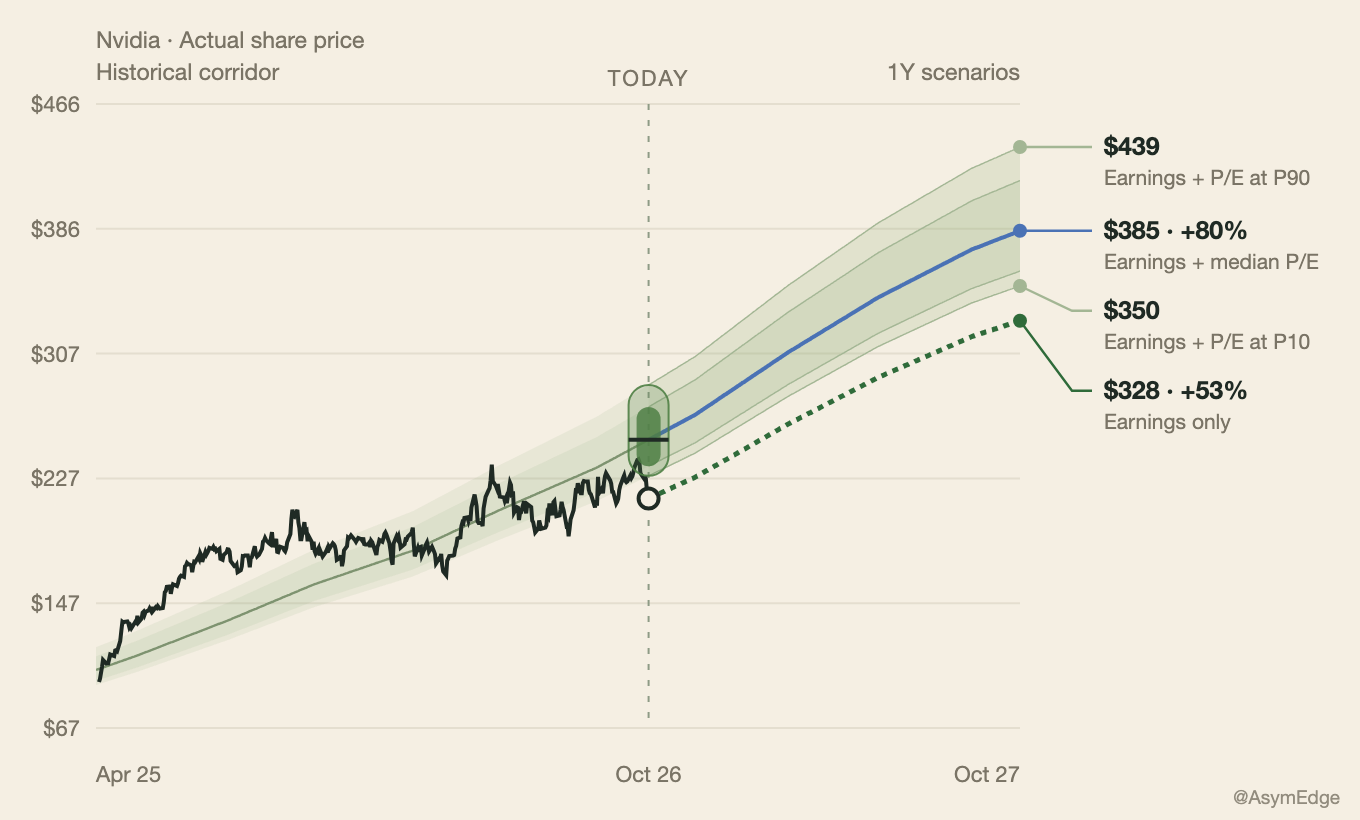
This chart shows conditional one-year price scenarios. It combines forecast earnings growth with a return to each stock’s median P/E over three historical windows. NVIDIA’s one-year-median-P/E scenario is about 80% above Friday’s price. Roughly 53 percentage points come from forecast earnings growth at today’s multiple; the rest requires the P/E to recover. These are scenarios, not forecasts.
4. The setup
Nvidia: the earnings test behind the selloff
Research setup · prices at 2026-10-16
Why it is interesting. NVIDIA fell 6.6% this week while its earnings estimates barely moved. At about 16.6 times NTM earnings, its P/E is near the bottom of its three-month, one-year and two-year ranges, despite a forecast for roughly 53% earnings growth over the next year.
What needs to happen. The 17 November results need to show demand, guidance and gross margins strong enough to keep those earnings forecasts intact.
What would change the view. If guidance or margins disappoint and estimates fall, the lower P/E may be justified.
NVIDIA is a useful test of this selloff. Its shares fell 6.6% this week, yet our four-week split shows almost no change in earnings estimates. Investors have cut the multiple they will pay before analysts have cut the profits they expect. The stock now trades near the bottom of its own valuation ranges across three months, one year and two years.
Recent results from ASML and TSMC show strong demand for chipmaking equipment and leading-edge capacity, but they cannot settle NVIDIA's own earnings case. Its 17 November report needs to show that demand is reaching revenue and gross margins, and that guidance supports the forecast growth. If estimates hold, today's lower multiple deserves another look. If they fall, the apparent discount could vanish.
5. Next week
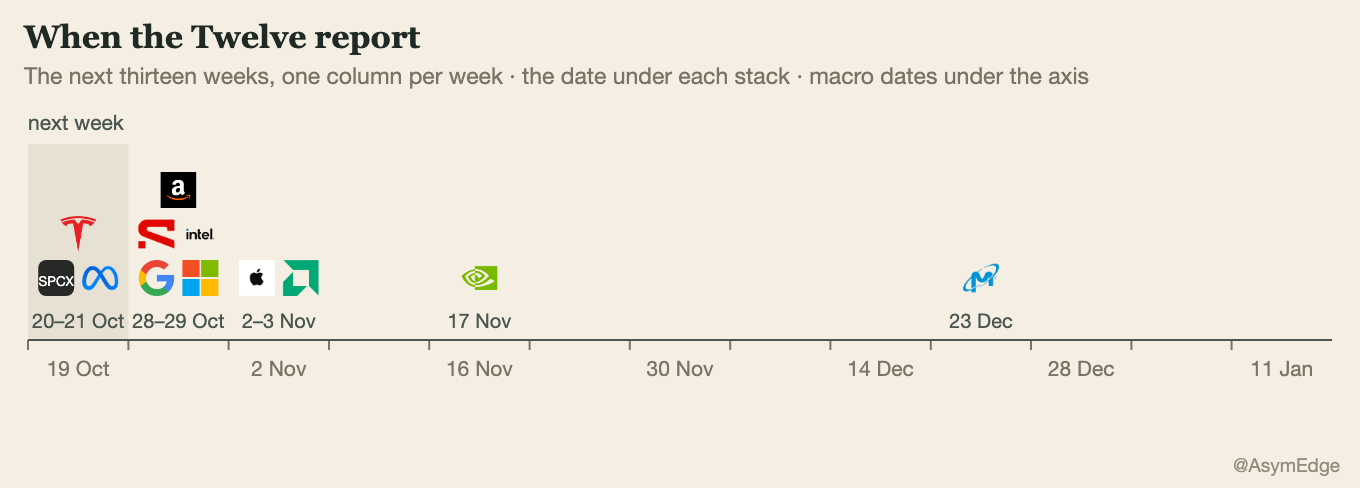
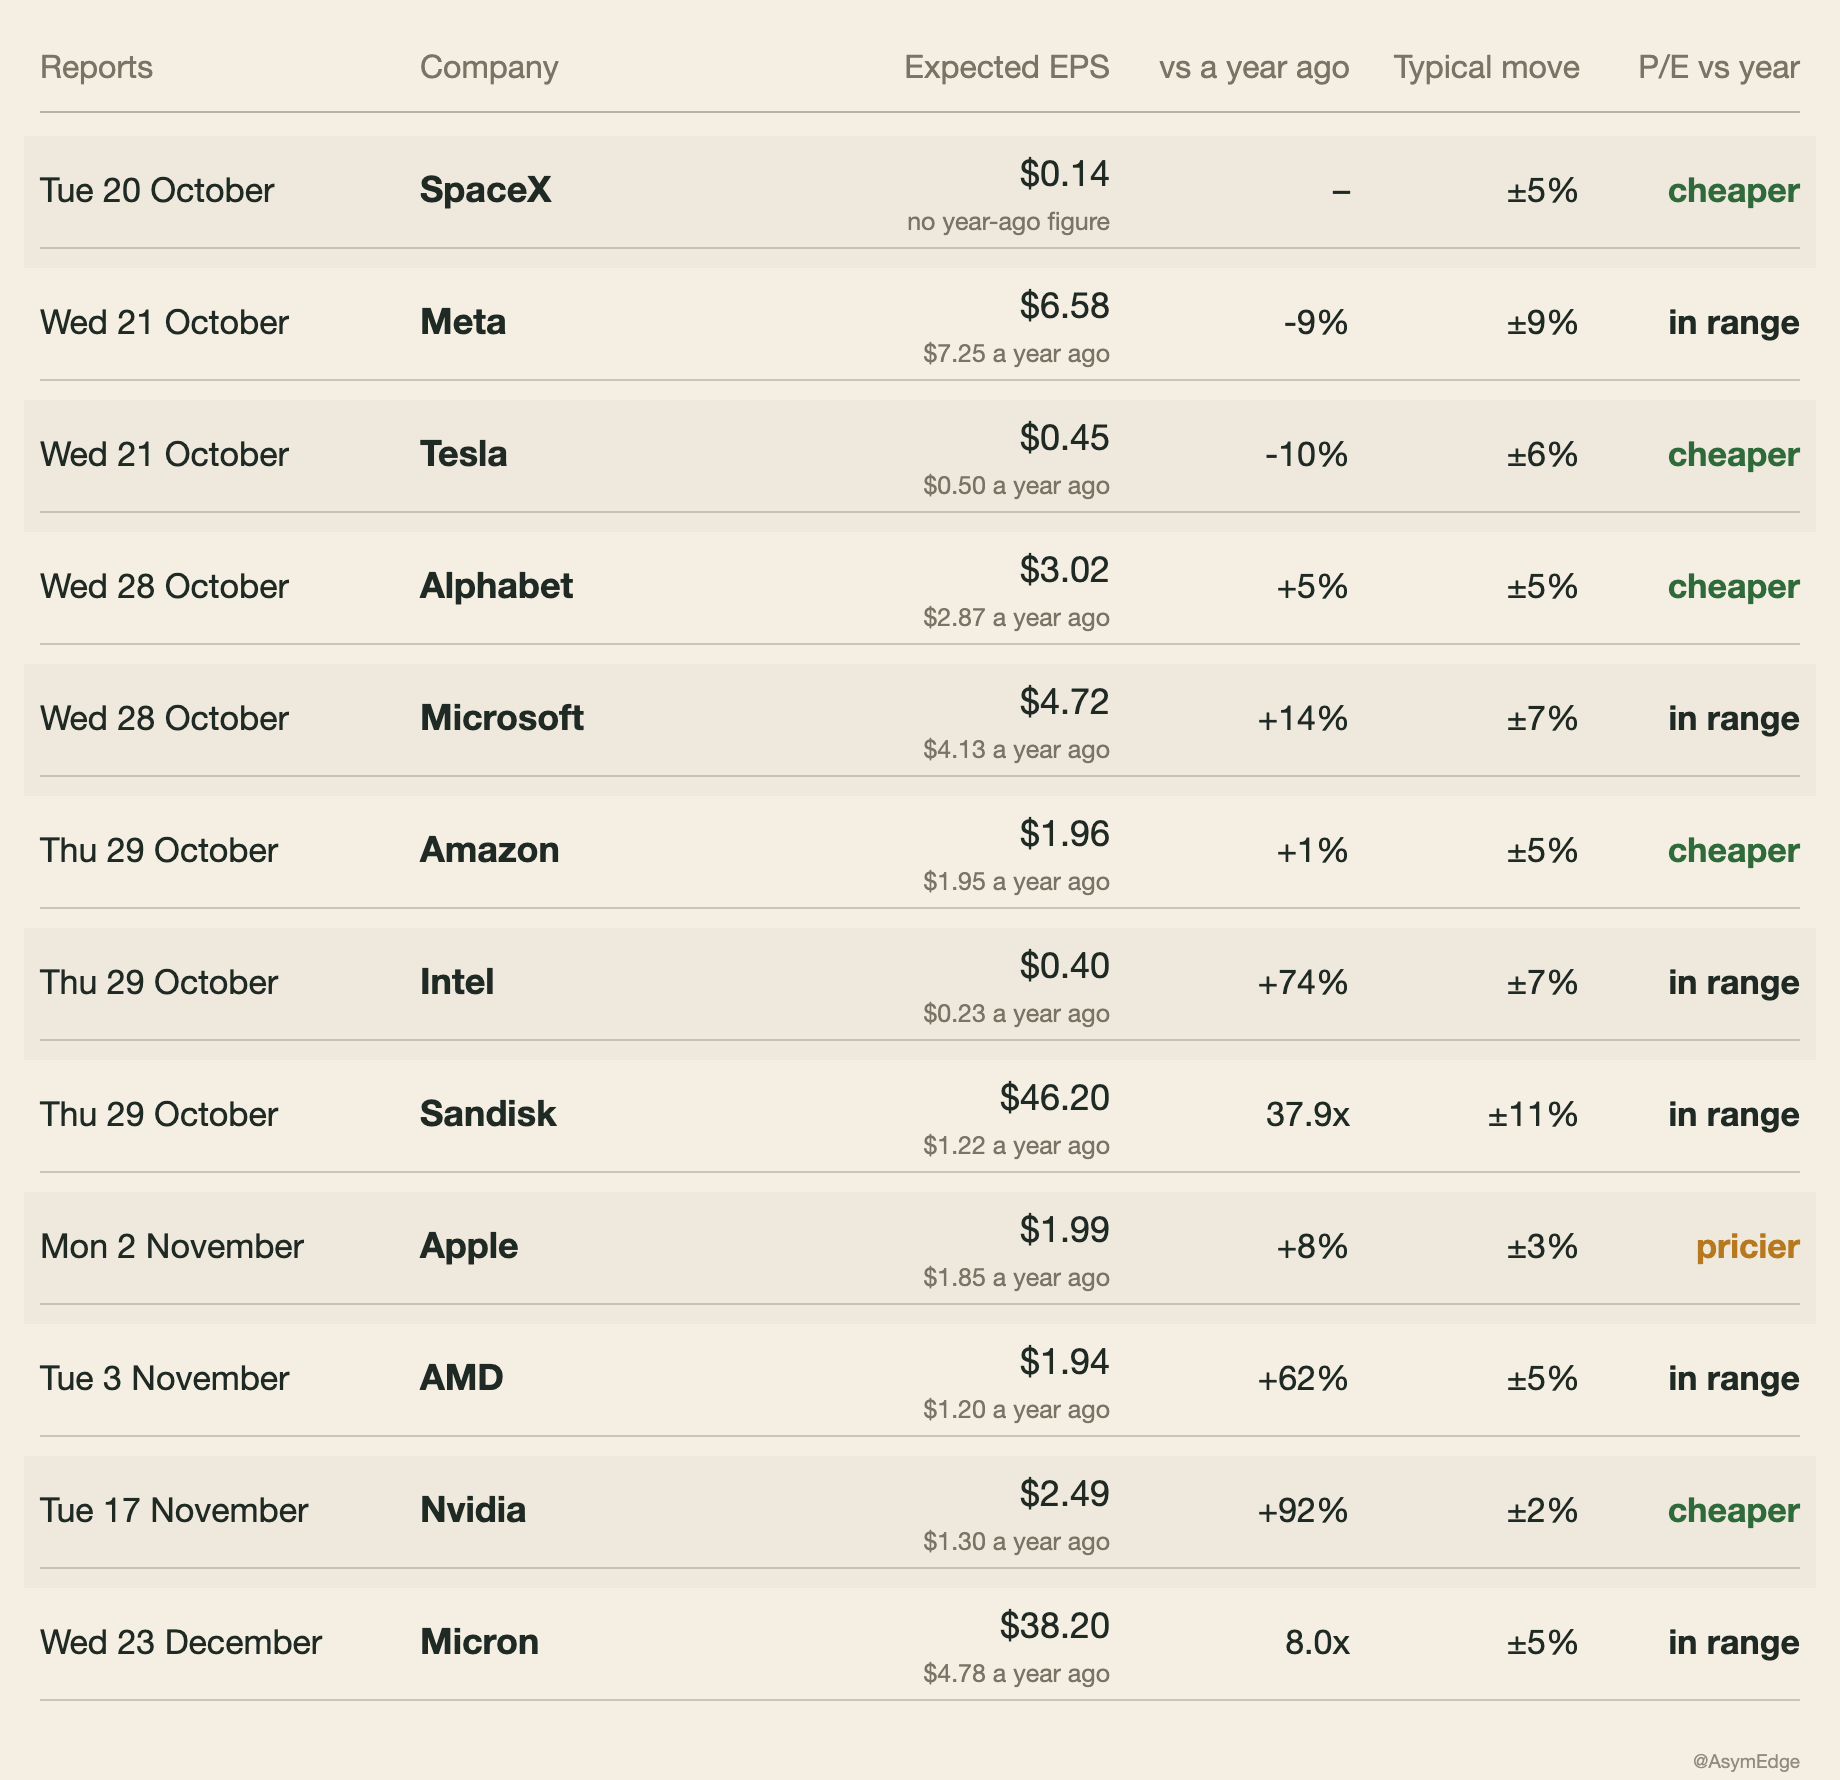
SpaceX reports Tuesday; Meta and Tesla follow Wednesday. Meta's $6.58 EPS estimate is about 9% below its adjusted year-ago base of $7.25, and Tesla's $0.45 estimate is 10% below a year ago. Their guidance matters more than a beat against one quarter's estimate: watch Meta's AI spending and returns, and Tesla's demand and auto margins.
The memory test comes later: Sandisk reports on 29 October, and Micron follows in December. Micron has disclosed multi-year customer supply agreements with committed volumes and pricing terms. The question is whether those commitments, current pricing and gross margins can sustain earnings beyond the usual memory cycle. A large gain over last year's low base would not answer it.
The main thing to watch after the chip selloff is whether earnings estimates start to fall. If forecasts hold while share prices and P/Es decline, this looks more like a valuation reset. Cuts to guidance and estimates would point to a deeper change. Market breadth and real yields will show whether the pressure is spreading beyond technology.
What each print has to clear
For now, this looks like a concentrated repricing of the AI trade. Chip supplier demand remains strong, and the next earnings reports will show whether company forecasts can withstand the change in sentiment.
Sources: Market Data from Tiingo.com · FRED (rates and credit) · FINRA (margin debt) · FactSet (S&P 500 NTM P/E)
For information only; not personalised investment advice. Figures are as of Friday, 16 October 2026.