Staying Rich Is a Solved Problem
The index is the bar every pick has to beat, and it’s also where I’ll park the money once I’m done climbing.
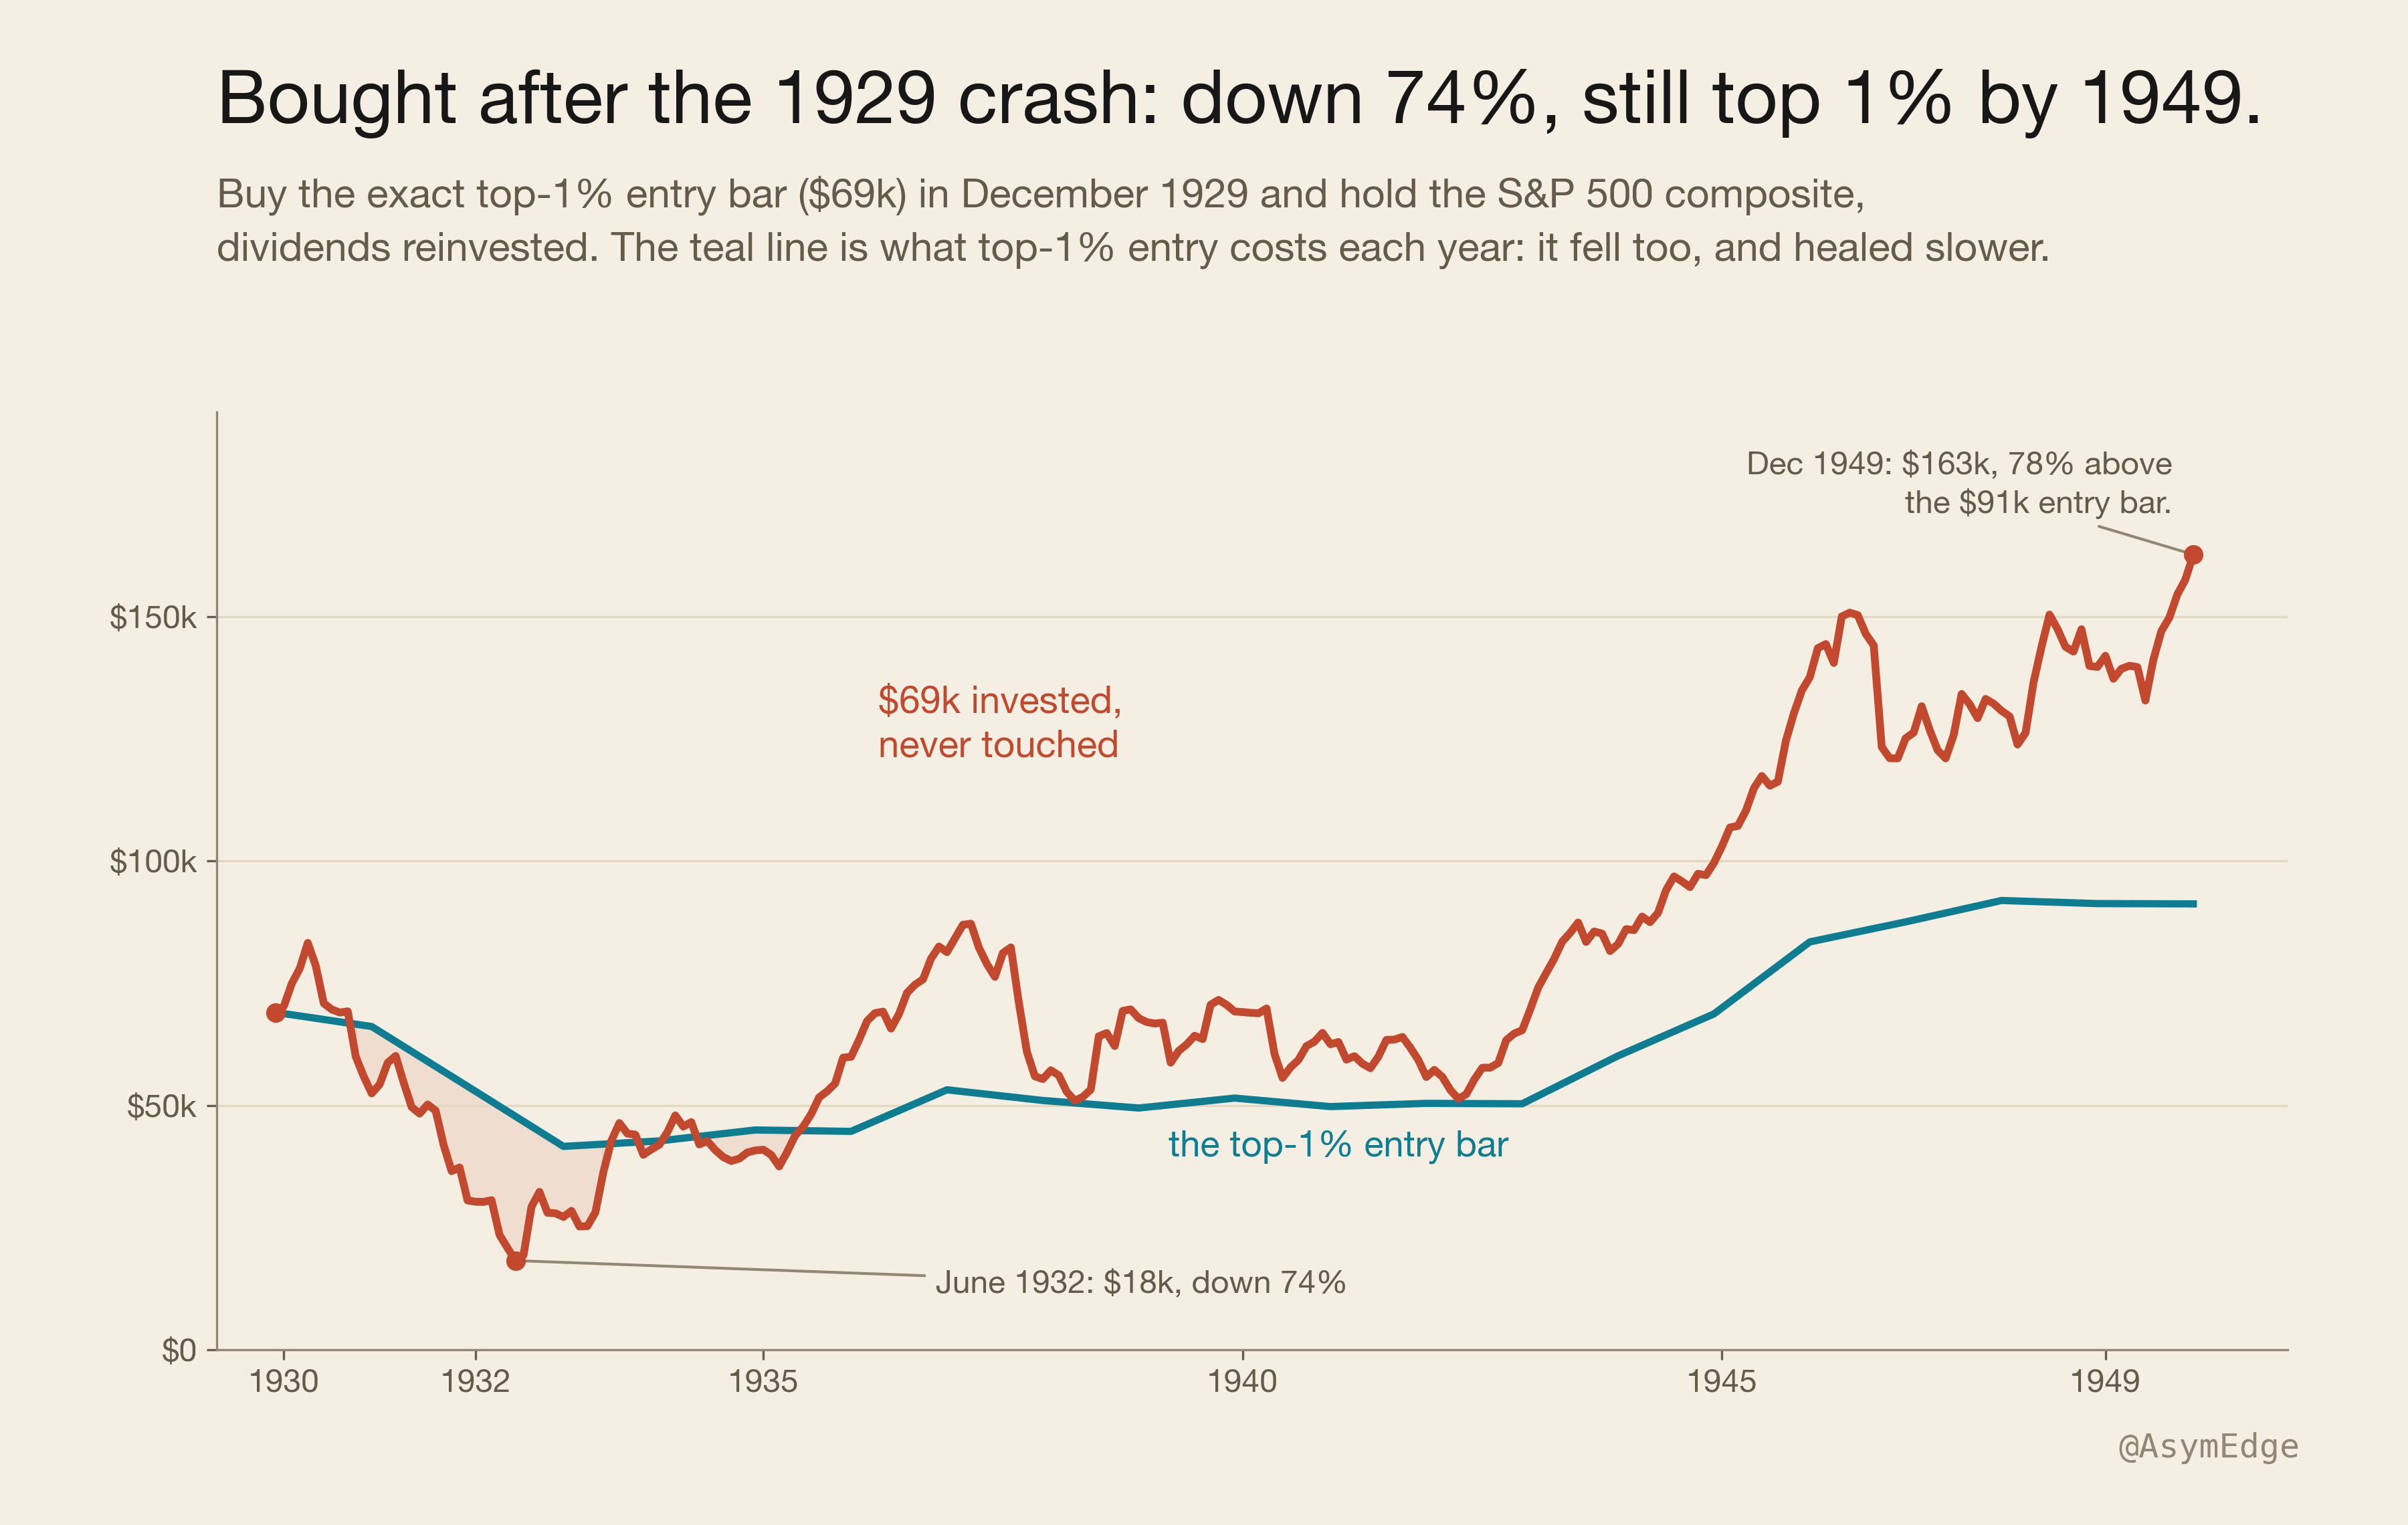
Imagine it’s December 1929 and you just barely entered the richest 1% of the US with a net worth of $69,000. You decide to invest that money in the broad stock market, similar to what the S&P 500 is today.
The Black Tuesday crash already happened two months ago and the market sits a third below its previous all-time high, so you think the worst is over.
Well, it isn’t … over the next two and a half years the crash continues and takes another 74% from you.
Now jump to 1949. Twenty years later, after the Great Depression and a world war.
The question: Are you still in the top 1%?
Surprisingly, you are, and by a wide margin. While you barely made it into the top 1% back in 1929, you are now 78% above the 1949 entry bar. Your portfolio is worth $163,000 and you moved up the wealth ladder.
This was a big surprise to me as I was actually trying to prove the opposite. I always thought a passive portfolio would grow in absolute terms, but that you would lose your relative wealth position to people taking active risks (business owners etc.). Also I thought that it would be increasingly difficult to defend your position as you move up the wealth ladder, as competition should get fiercer.
So after this first surprising result my two questions were:
- Is this generally true or only for this time period?
- What about real wealth, the top 0.1%, 0.01% and beyond?
Before answering those questions, let’s take a quick detour on why your wealth percentile is the only thing that matters and absolute numbers are meaningless. The detour uses global numbers; the test itself uses only US data.
The wealth pyramid
People obsess too much about a specific net worth number they need to hit to retire or slow down, which is meaningless.
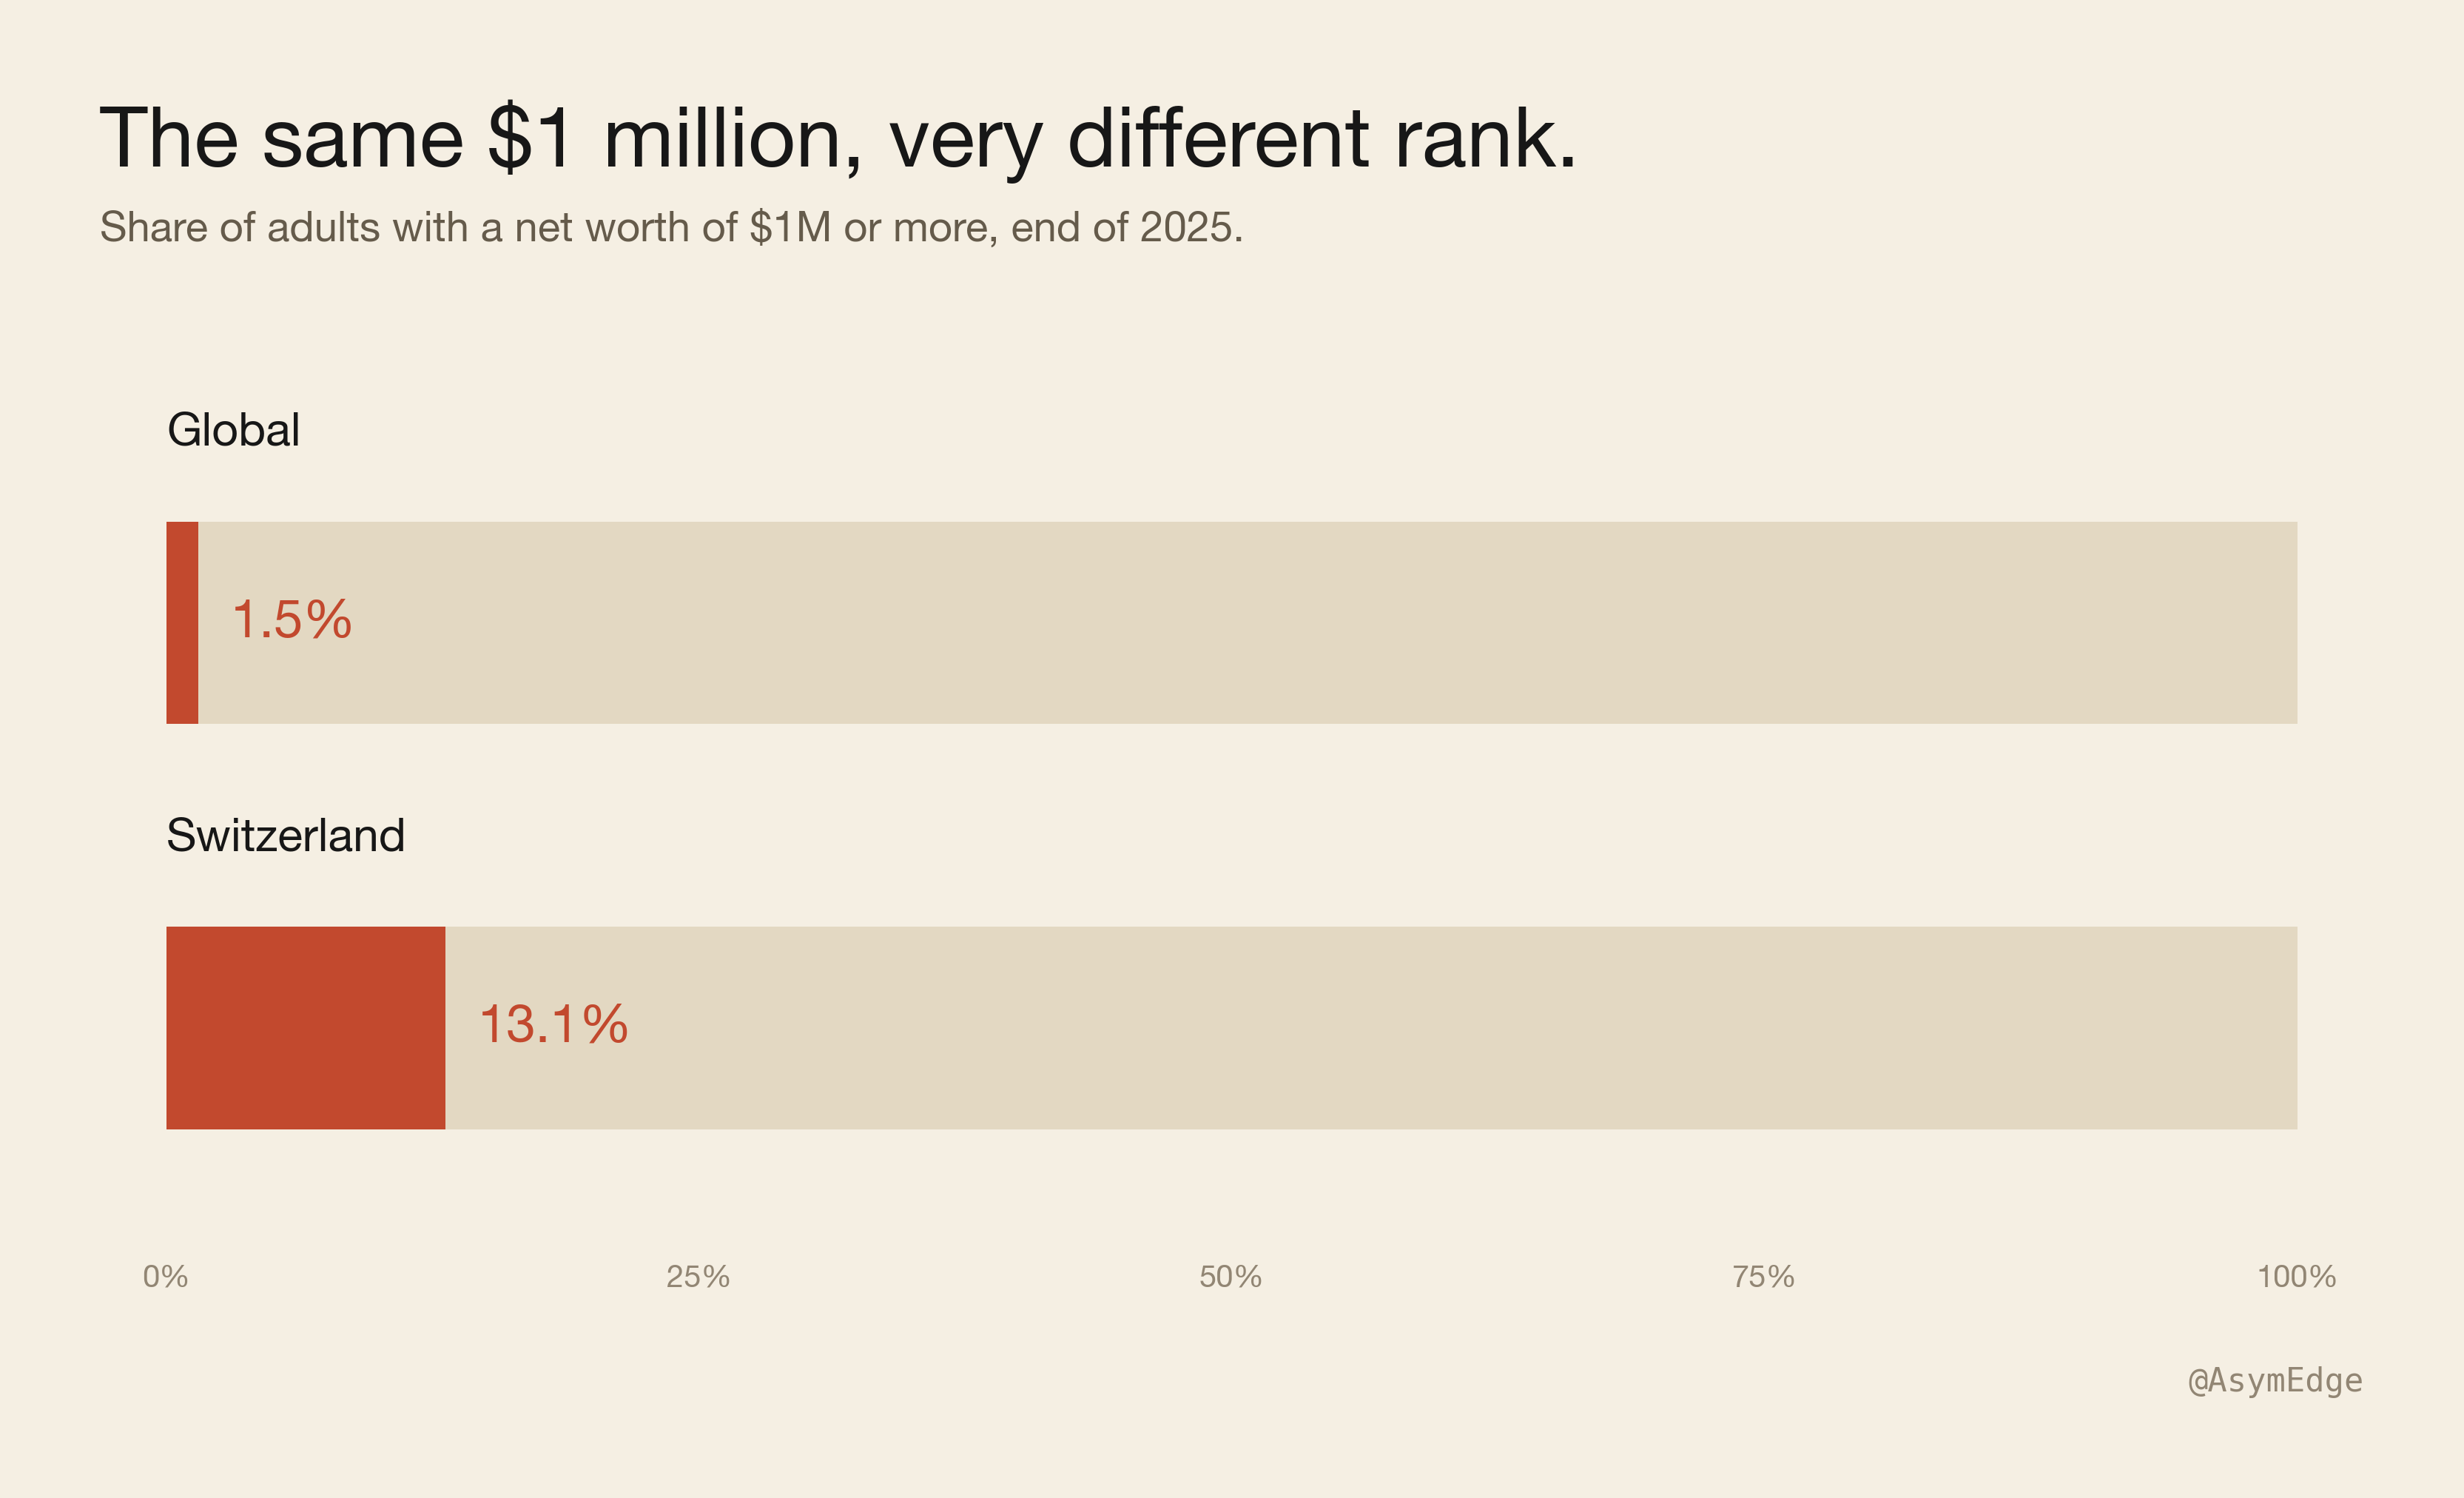
The only thing that matters is where you stand compared to your surroundings and peers. Let’s assume you have a net worth of $1M, which puts you in the top 1.5% globally.
Now let’s compare that to Switzerland where I live: more than one adult in eight clears $1M, so the same million that can provide a comfortable life somewhere else is not even enough to buy an apartment in the best areas.
The price of everything scarce, like the house with a lake view, the spot in the good private school, and so on, is set by the people ahead of you in the local queue, not by your global rank. A luxury home in Küsnacht, on Zurich’s Gold Coast, costs about 37,000 CHF a square meter. Your “top-1.5%-of-the-planet million” buys about 22 square meters there, a studio, not the house.
Methodology
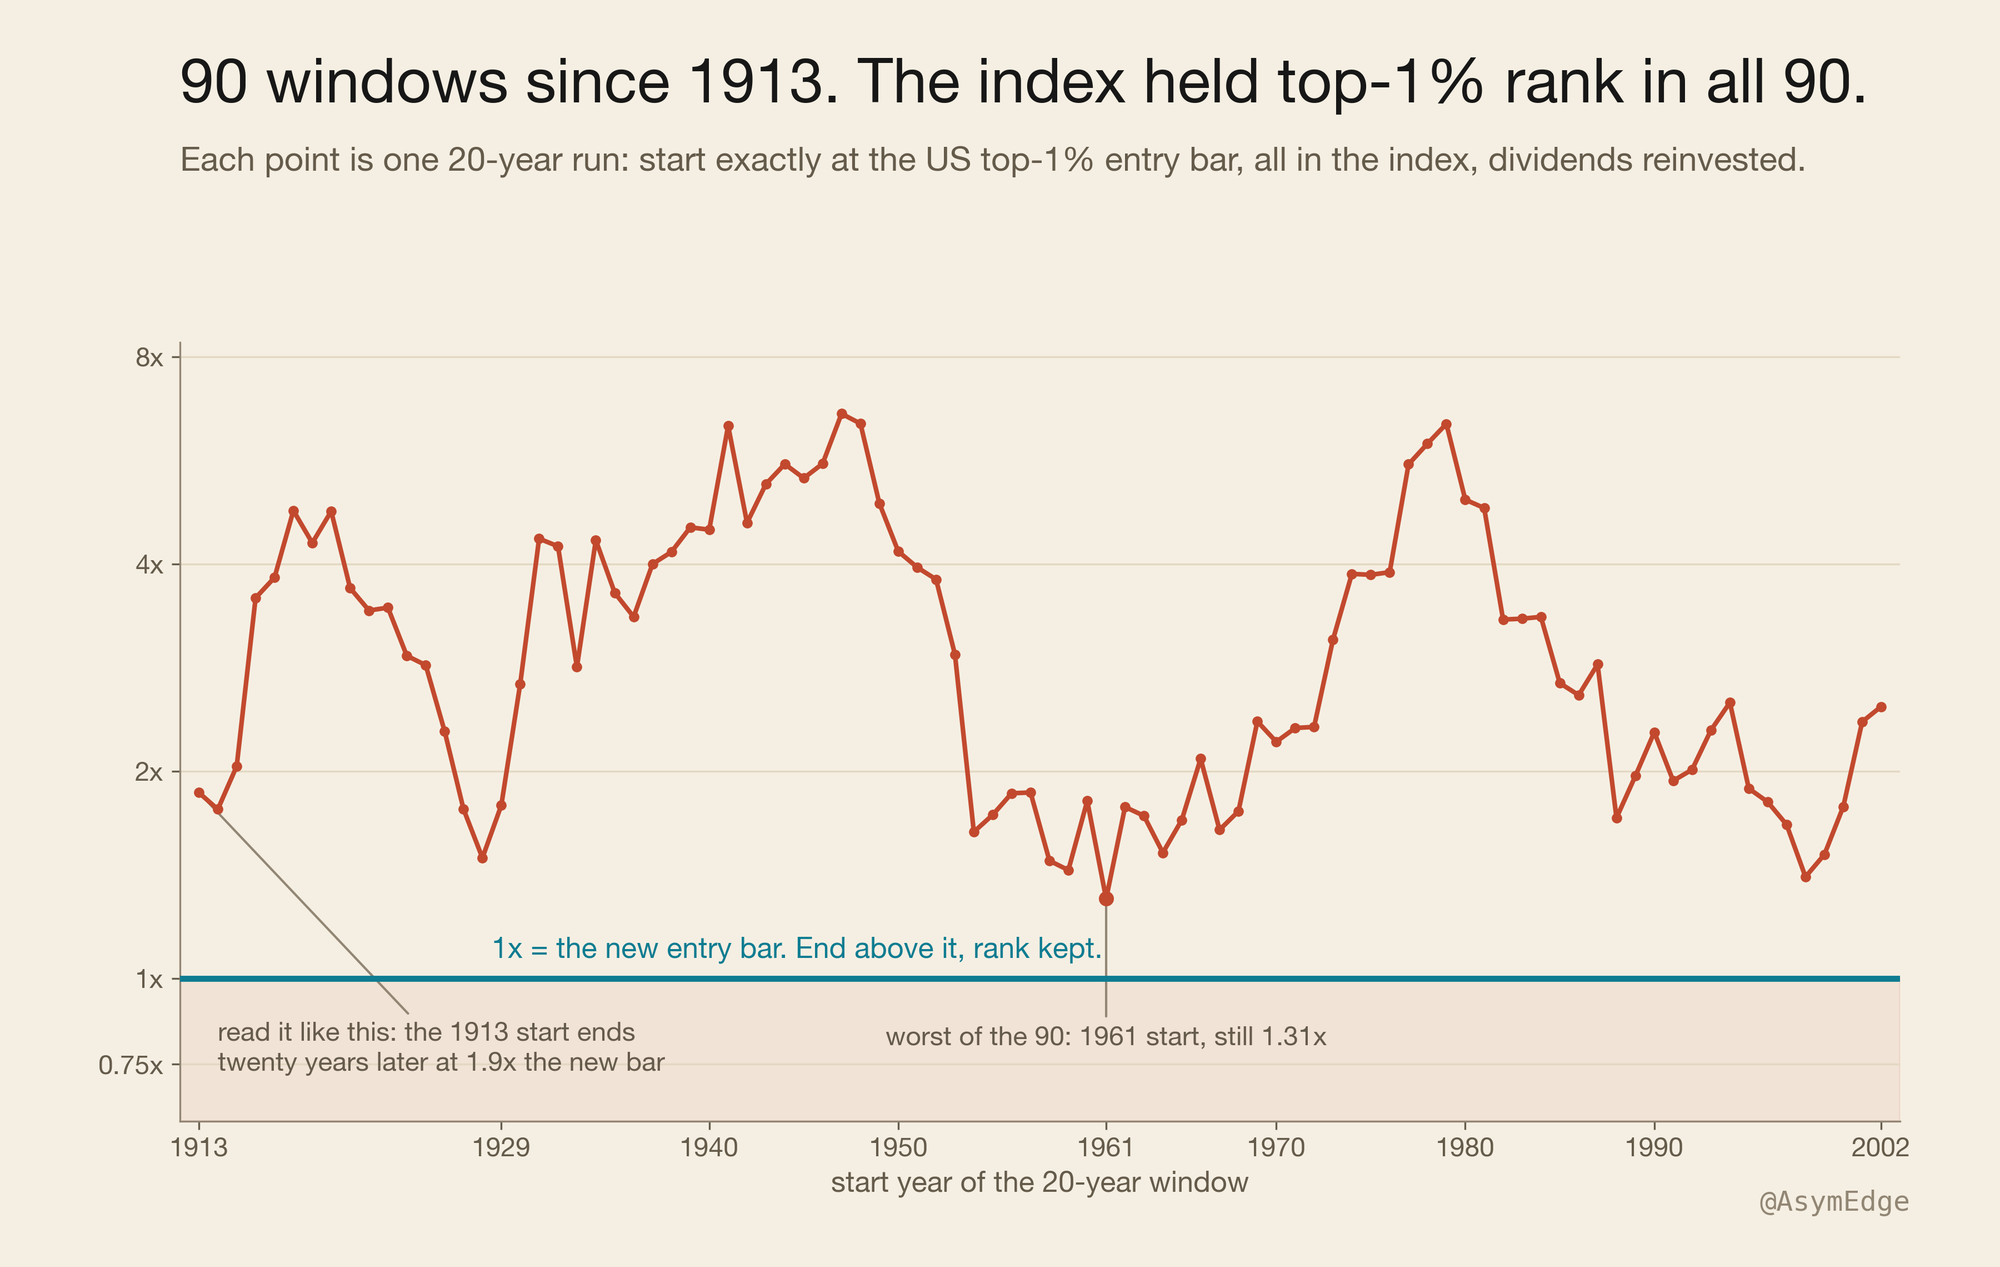
The test runs on US data as there is over a century of tax records, showing how much wealth it took to enter the US top 1% for every year back to 1913. Every year, the simulation takes that number and invests it into a broad US stock index, reinvests the dividends, adds nothing, takes nothing. Twenty years later, the final portfolio value is compared against the new entry bar needed to be in the top 1%.
If you end above 1.0x, you kept your rank doing nothing at all. This was repeated for all 90 twenty-year periods since 1913. The tax treatment, the pre-1957 index, and the nominal-dollar choice are in the method note.
The result: 90 of 90
It held in all 90 periods. The periods overlap, so this is one century seen 90 ways, not 90 separate tests. The median window ends at 2.8x the bar, and the worst one, the 1961 start that runs straight into two flat decades, still comes out 31% ahead.
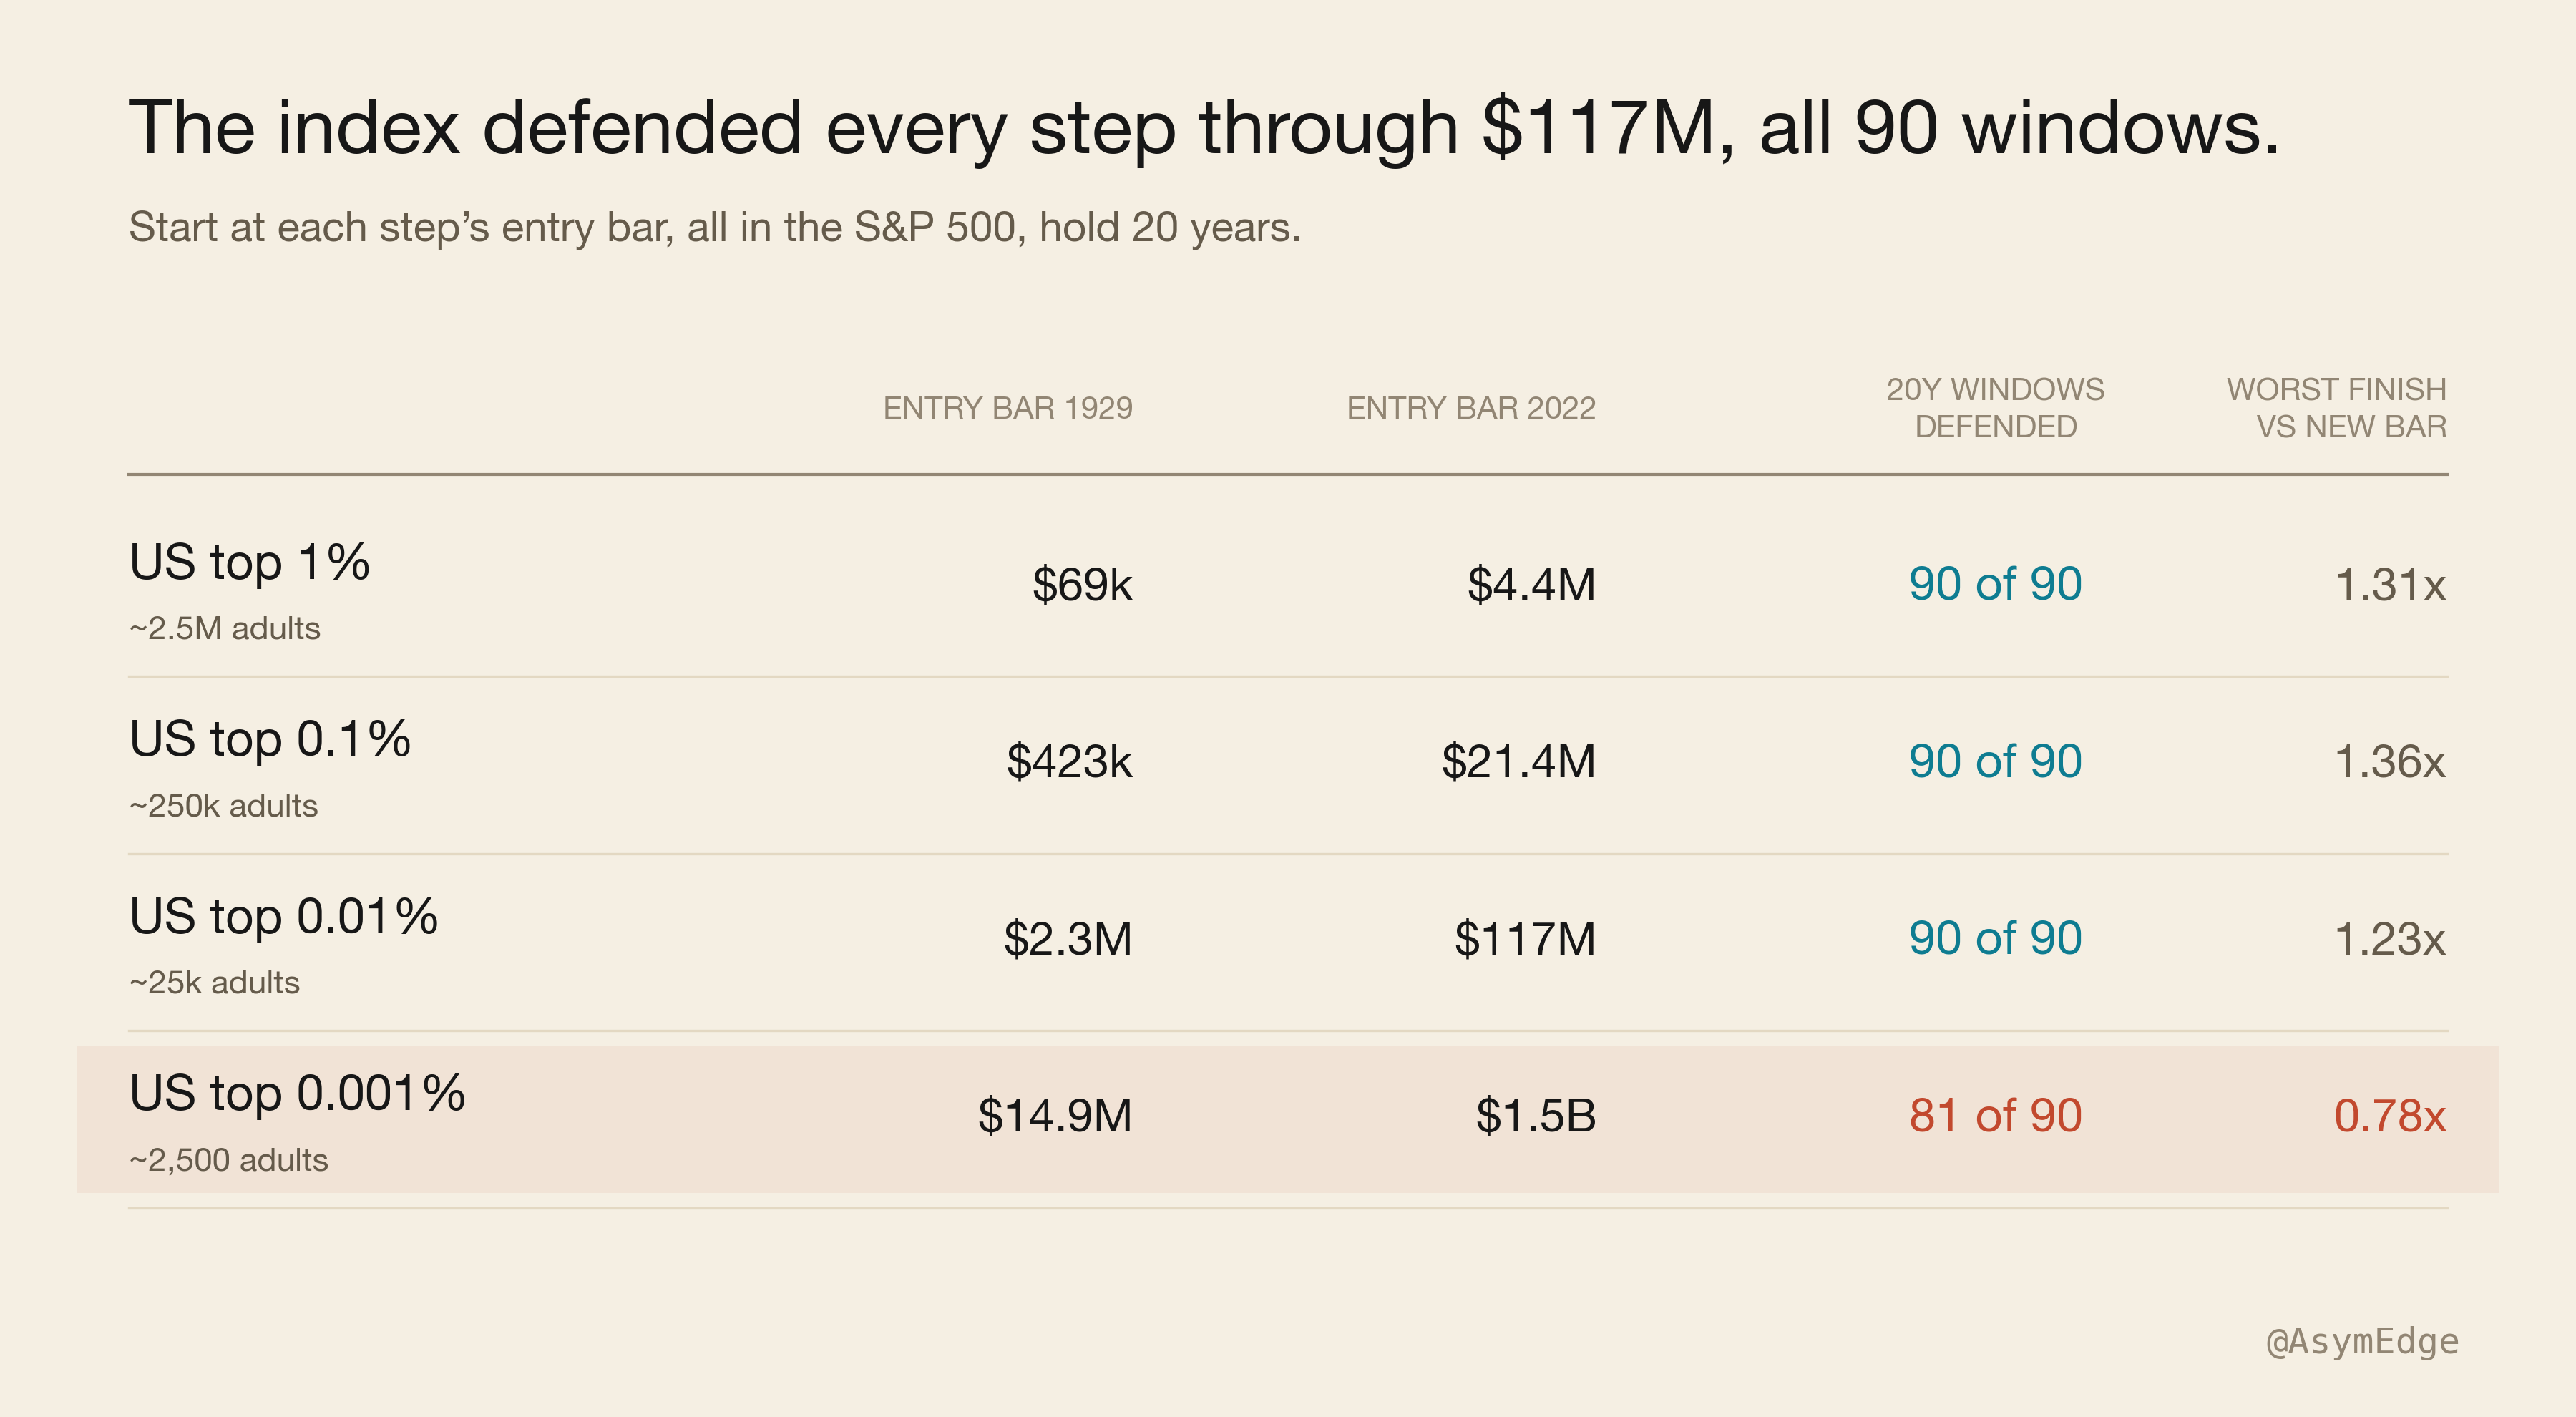
I then went up the wealth ladder and repeated the same test with the top 0.1%, as I was expecting that money at those levels compounds faster. Well, it doesn’t. Someone in the top 0.1% would have defended his position 90 of 90 times. The same for the top 0.01%. The worst periods ended at 1.23x or higher.
The only exception is the top 0.001%, and I’ll come back to what’s different up there later on.
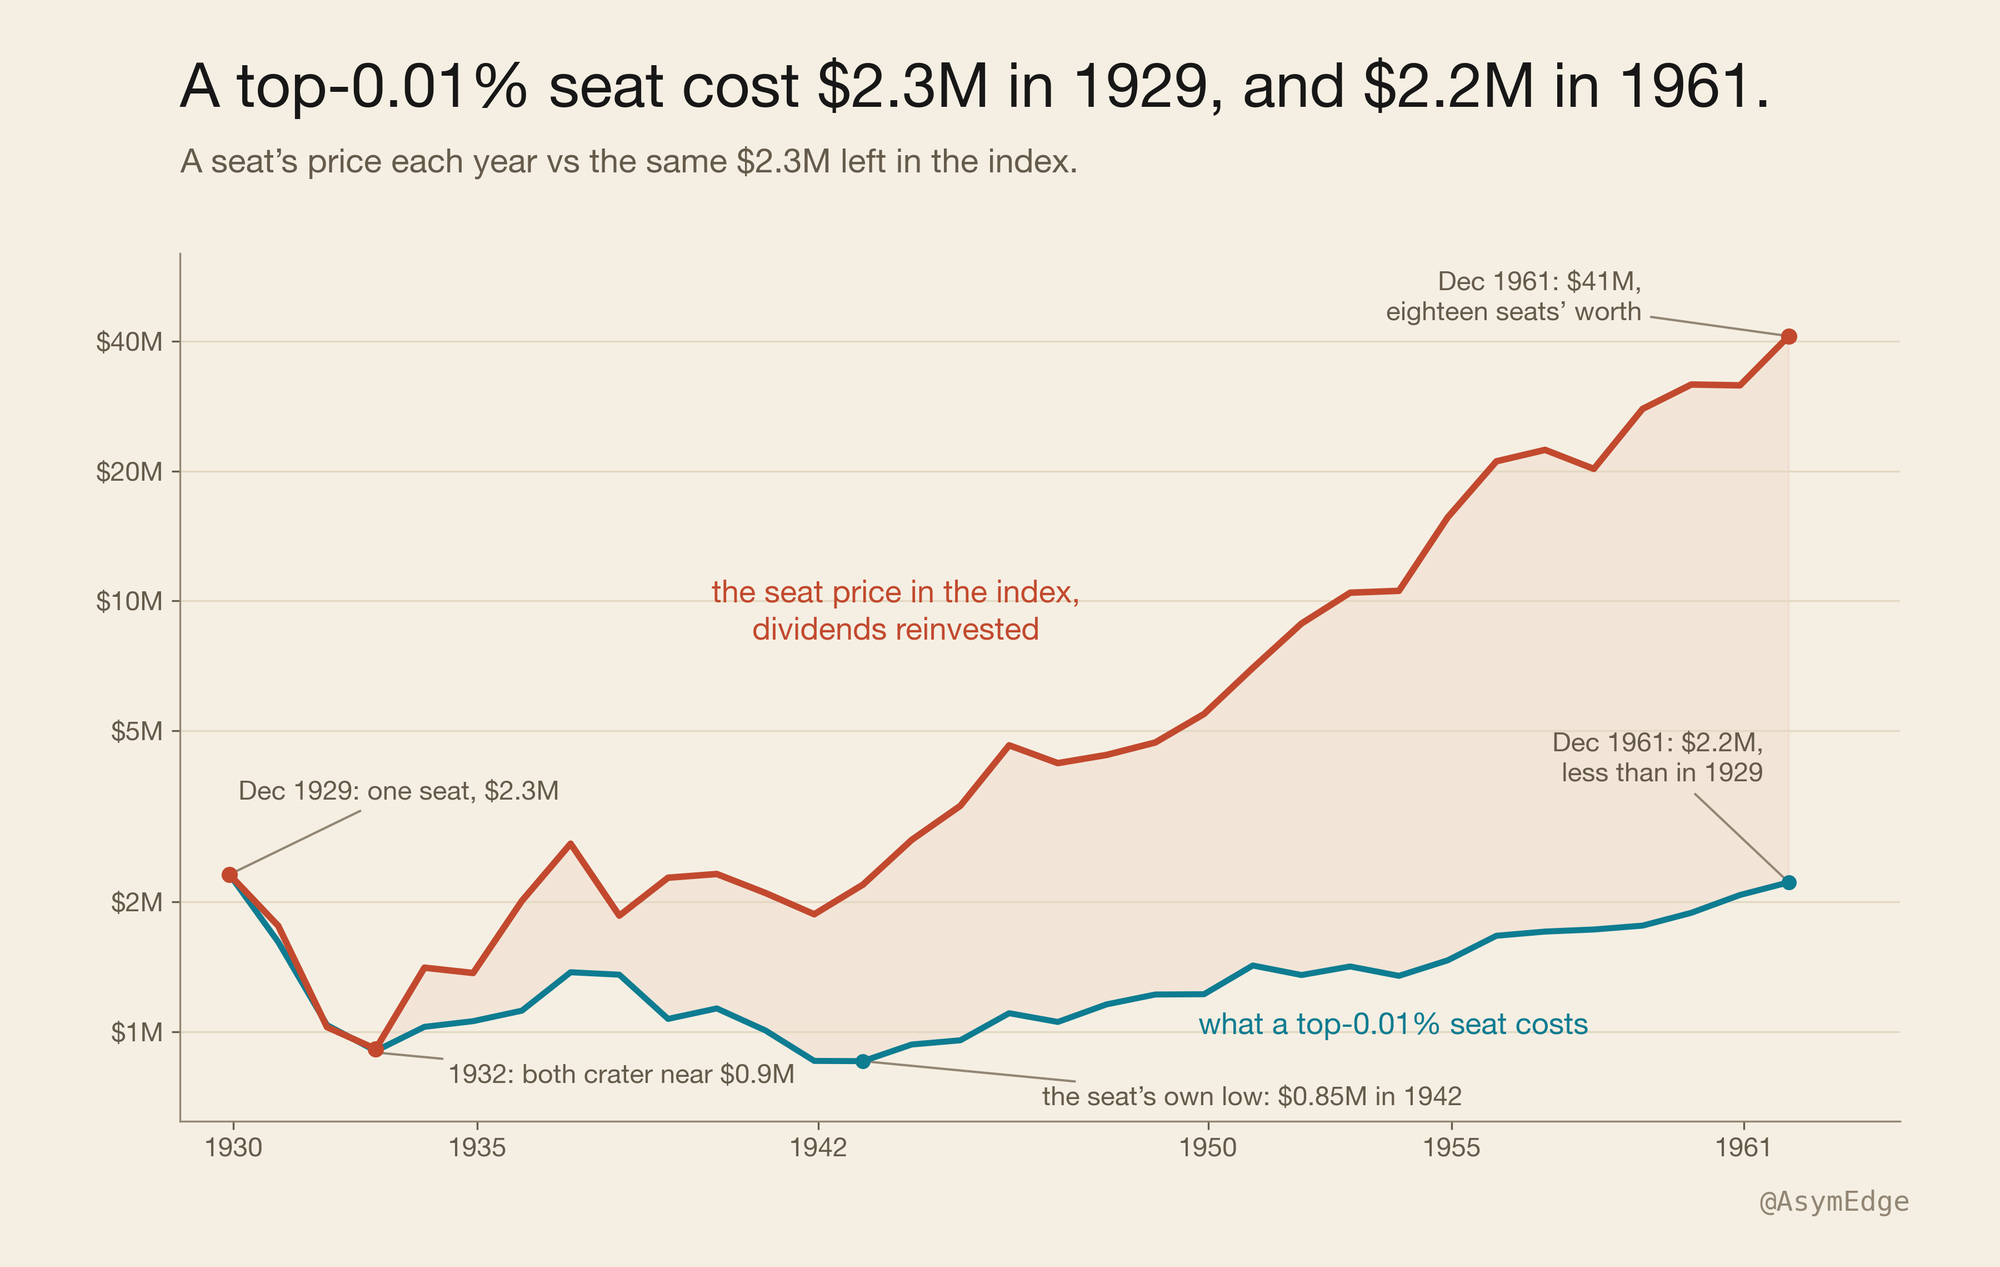
One of the most surprising findings was about the Great Depression. Entering the top 0.01% cost $2.3M in 1929 and $2.2M in 1961. So after a period of 32 years it actually was cheaper to be part of the top 0.01%. Investing that money in the index with dividends reinvested would have multiplied that money almost eighteen times.
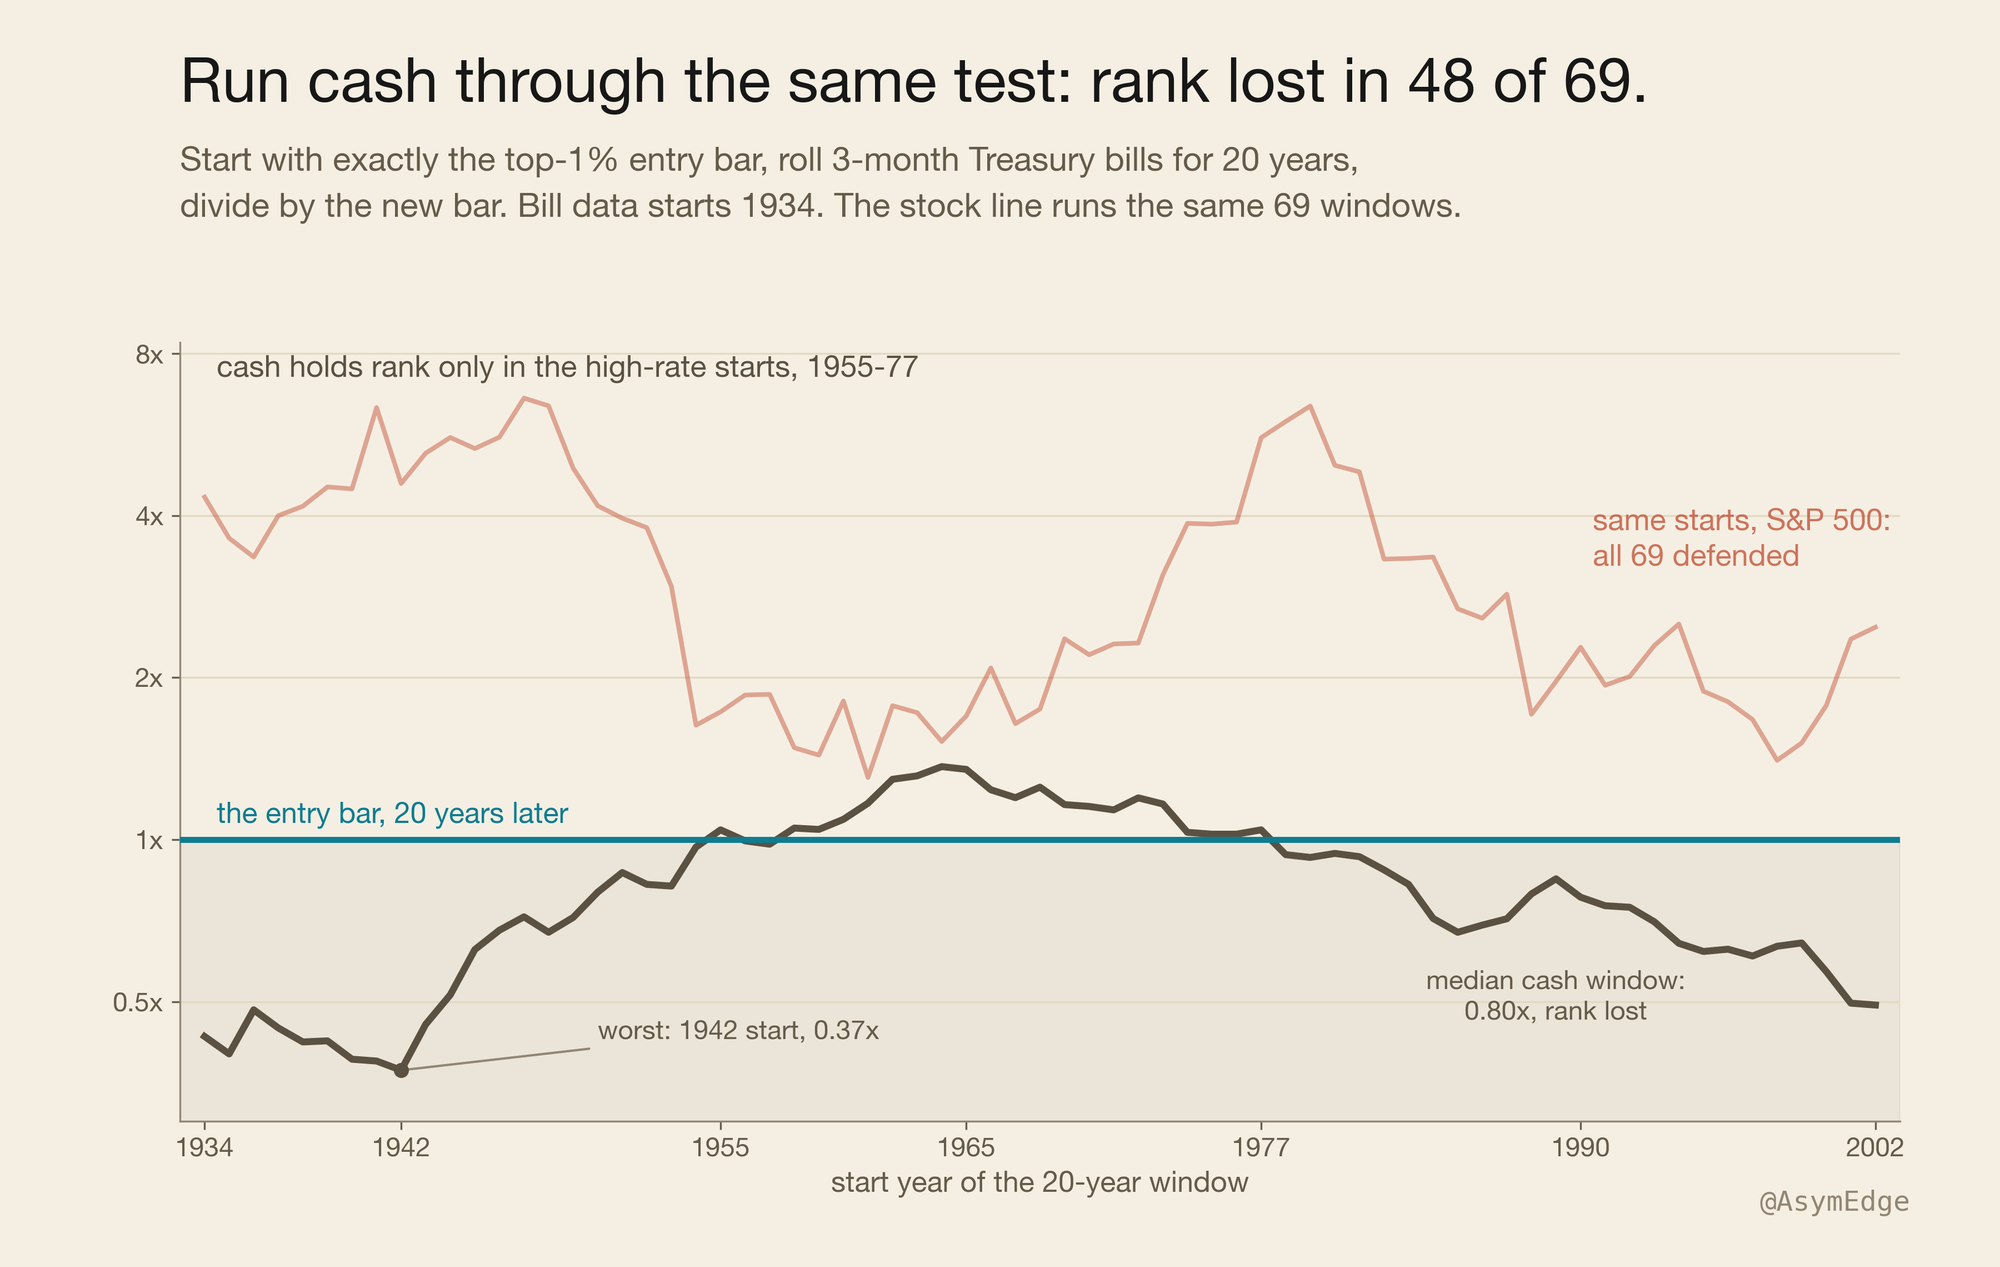
The next objection I had was that maybe the bar is just easy to clear. So I ran the same experiment investing in cash instead of the stock index, using three-month Treasury bills. The data for those starts in 1934, so we only have 69 windows instead of 90.
The results showed that you would have lost your wealth position 48 out of 69 times. The only exceptions start between 1955 and 1977, windows that ran into a period with high interest rates. This confirmed that the bar of keeping your wealth position is a real hurdle, which cash mostly fails, while stocks never did.
Why the bar grows so slowly
My first guess was that the rich are just bad investors, but the real reasons are actually quite boring.
First, on average across the century, about 1.4% more adults show up every year, and the bar has to share with all of them.
Second, the bar is a mix of houses, bonds, cash, and small businesses, not just stocks. Stocks have been the best of these for a hundred years. A mixed bag grows slower than all-stock. Nobody has to be bad at this for that to happen.
Third, real people spend their money. They pay tax on it every year. Estate tax alone hit 77% at its peak, every time wealth passed down a generation. People also divorce, split an estate three ways, or hold one stock too long and lose it.
So the people above you don’t need to be fools. They just need to be normal: pay tax, spend some, sometimes divorce, sometimes die.
New money keeps pushing the bar up too. Every year a new fortune joins the top 1% and raises the bar for everyone else. Without them, the bar would climb even slower.
Here’s the cleanest way to see the size of it. If every rich family just held the index and never touched it, the bar would rise almost as fast as the market, and you’d end up near 1.0x. Instead the middle result is 2.8x. Most of the gain leaks away before it ever reaches the bar.
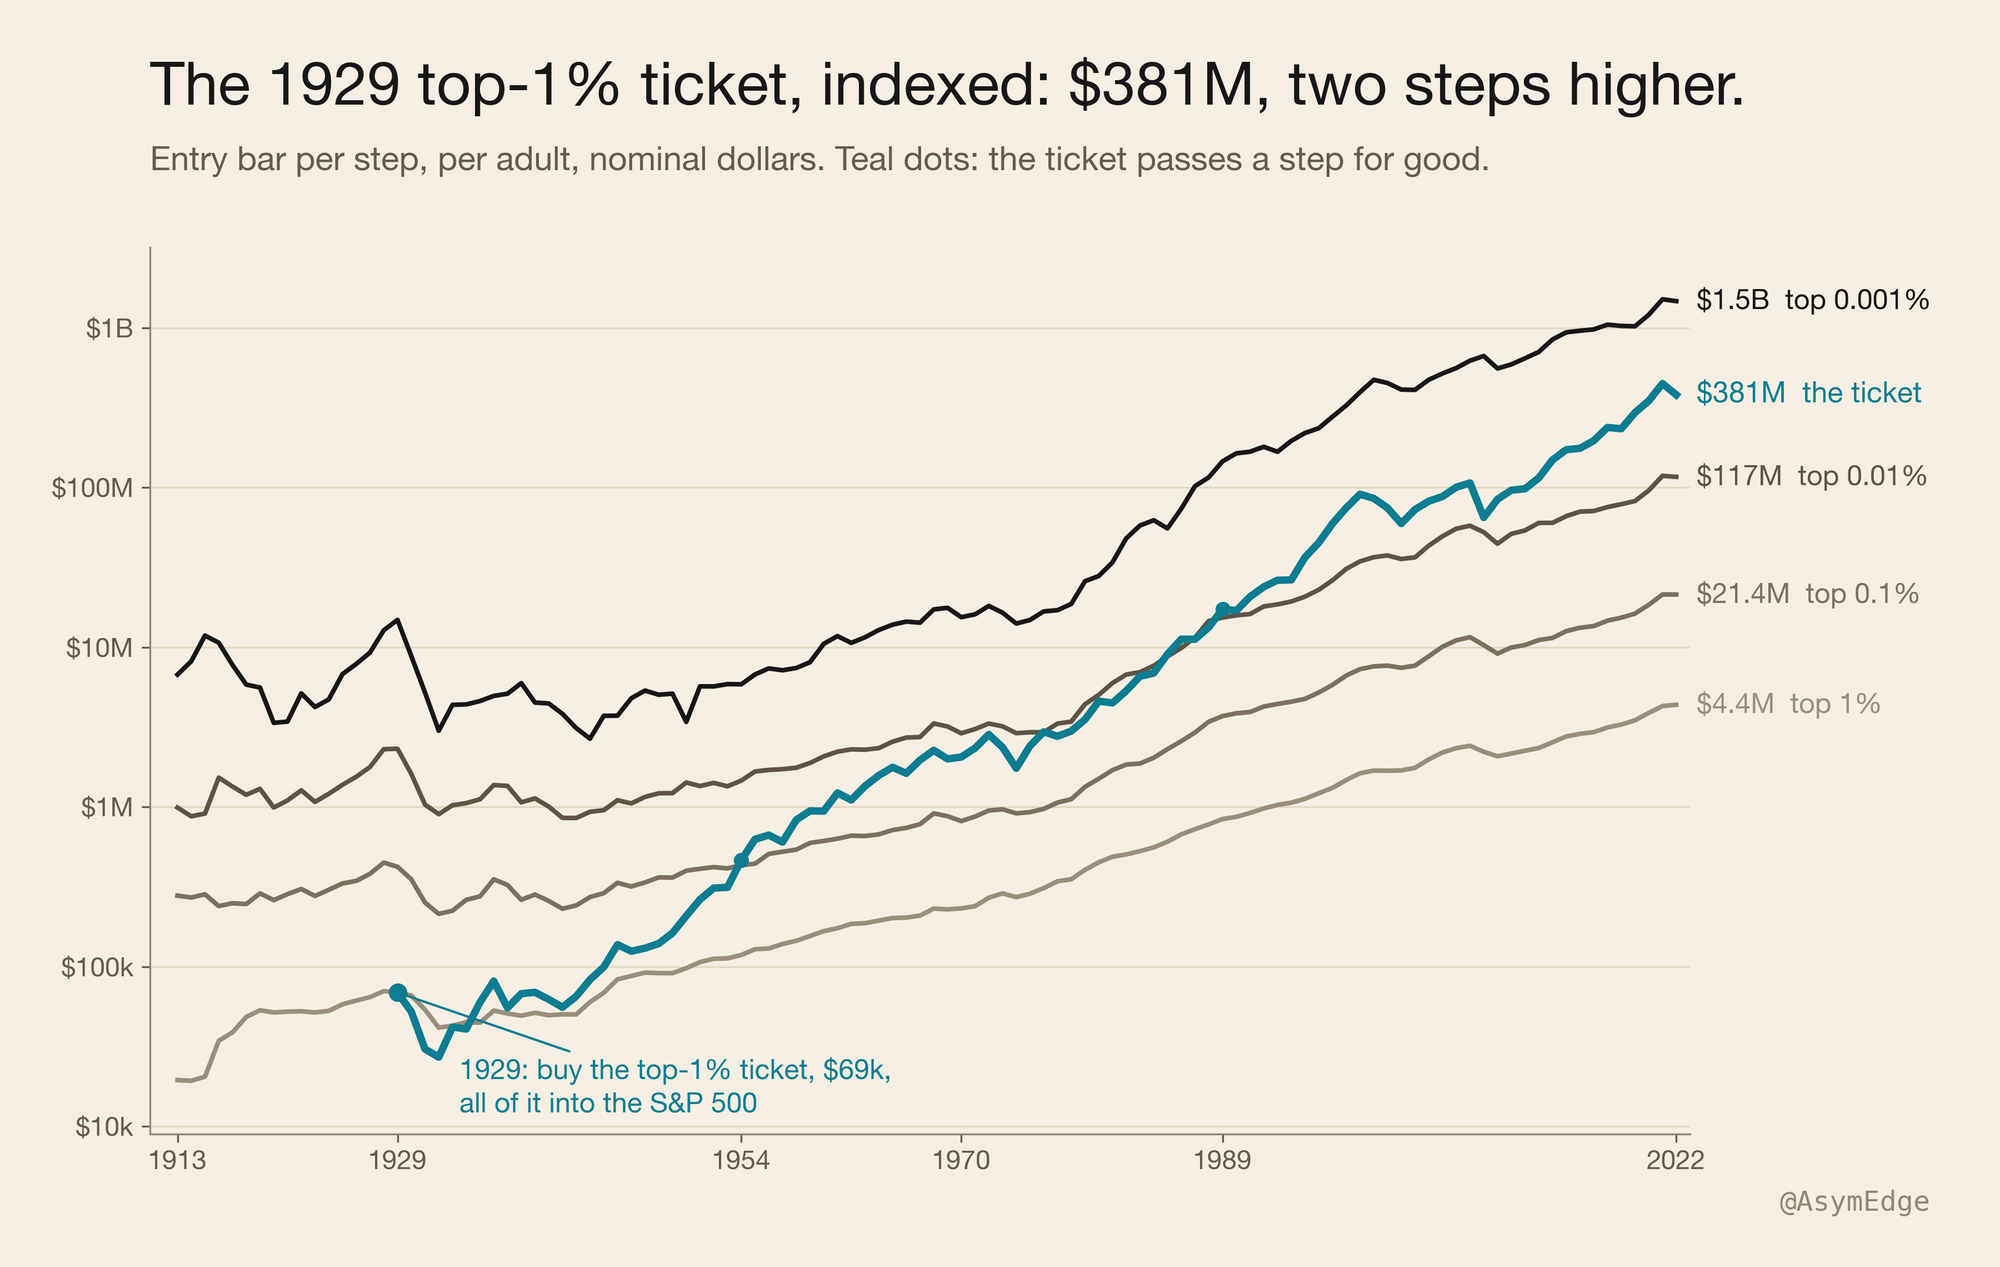
Take the 1929 ticket again, the $69k. Don’t stop at 20 years, just let it ride. By 2022 it’s $381M. It passes the 0.1% bar in 1954 and the 0.01% bar in 1989, two steps higher than where it started, worth a seat among the richest 25,000 people in the country.
The catch: the ticket never spends
Now the assumption that carries more weight than any other. The ticket never spends. The people in the bar do.
That asymmetry is a big part of why the index works like an escalator. The ticket compounds gross while the incumbents compound net of life.
I re-ran the numbers assuming a spending rate of 2% of the portfolio, and the count of periods in which the wealth position is preserved drops to 86 out of 90. At a full living rate of 3 to 4% the median window still clears but the guarantee of keeping the wealth position is gone.
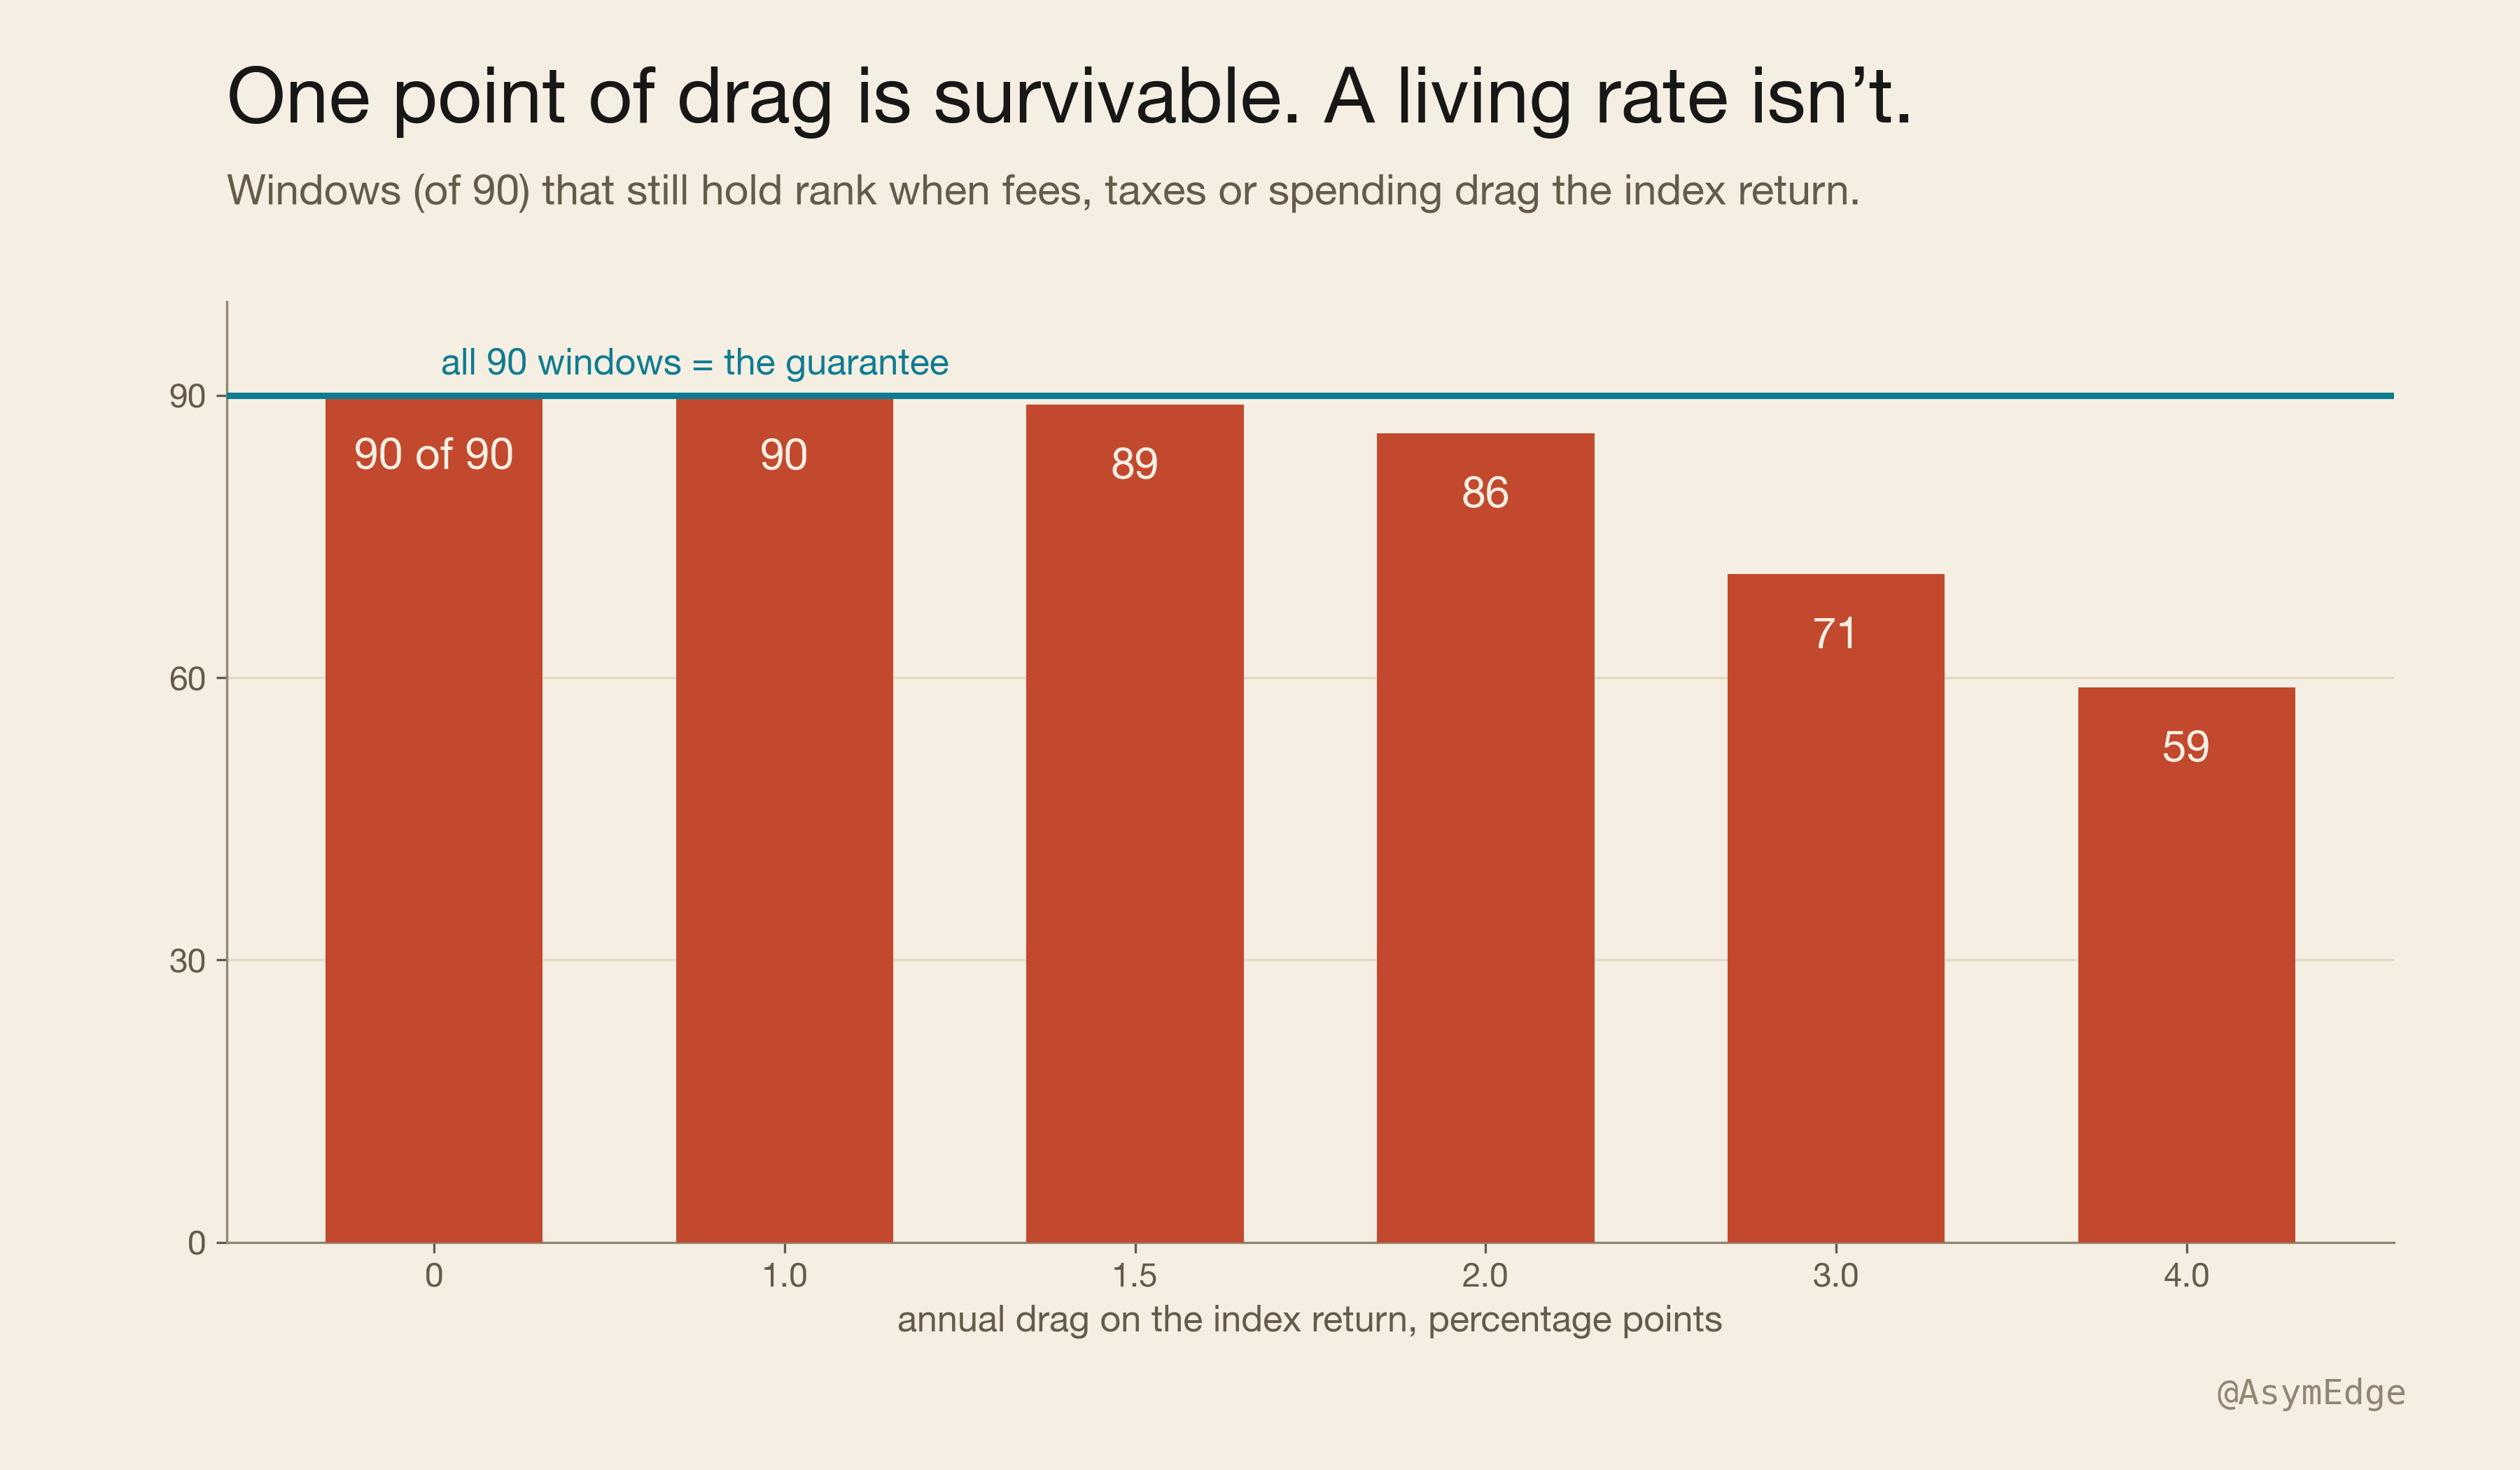
So the precise claim is narrower than the title. Parked wealth holds rank on autopilot. Wealth you live from is a different problem, one with sequence risk in it, and the untouched ticket never meets sequence risk. The escalator is for parked money. It was never rated for anyone who needs it to live.
Alpha is time
For parked money, the downside is solved. Which leaves the upside.
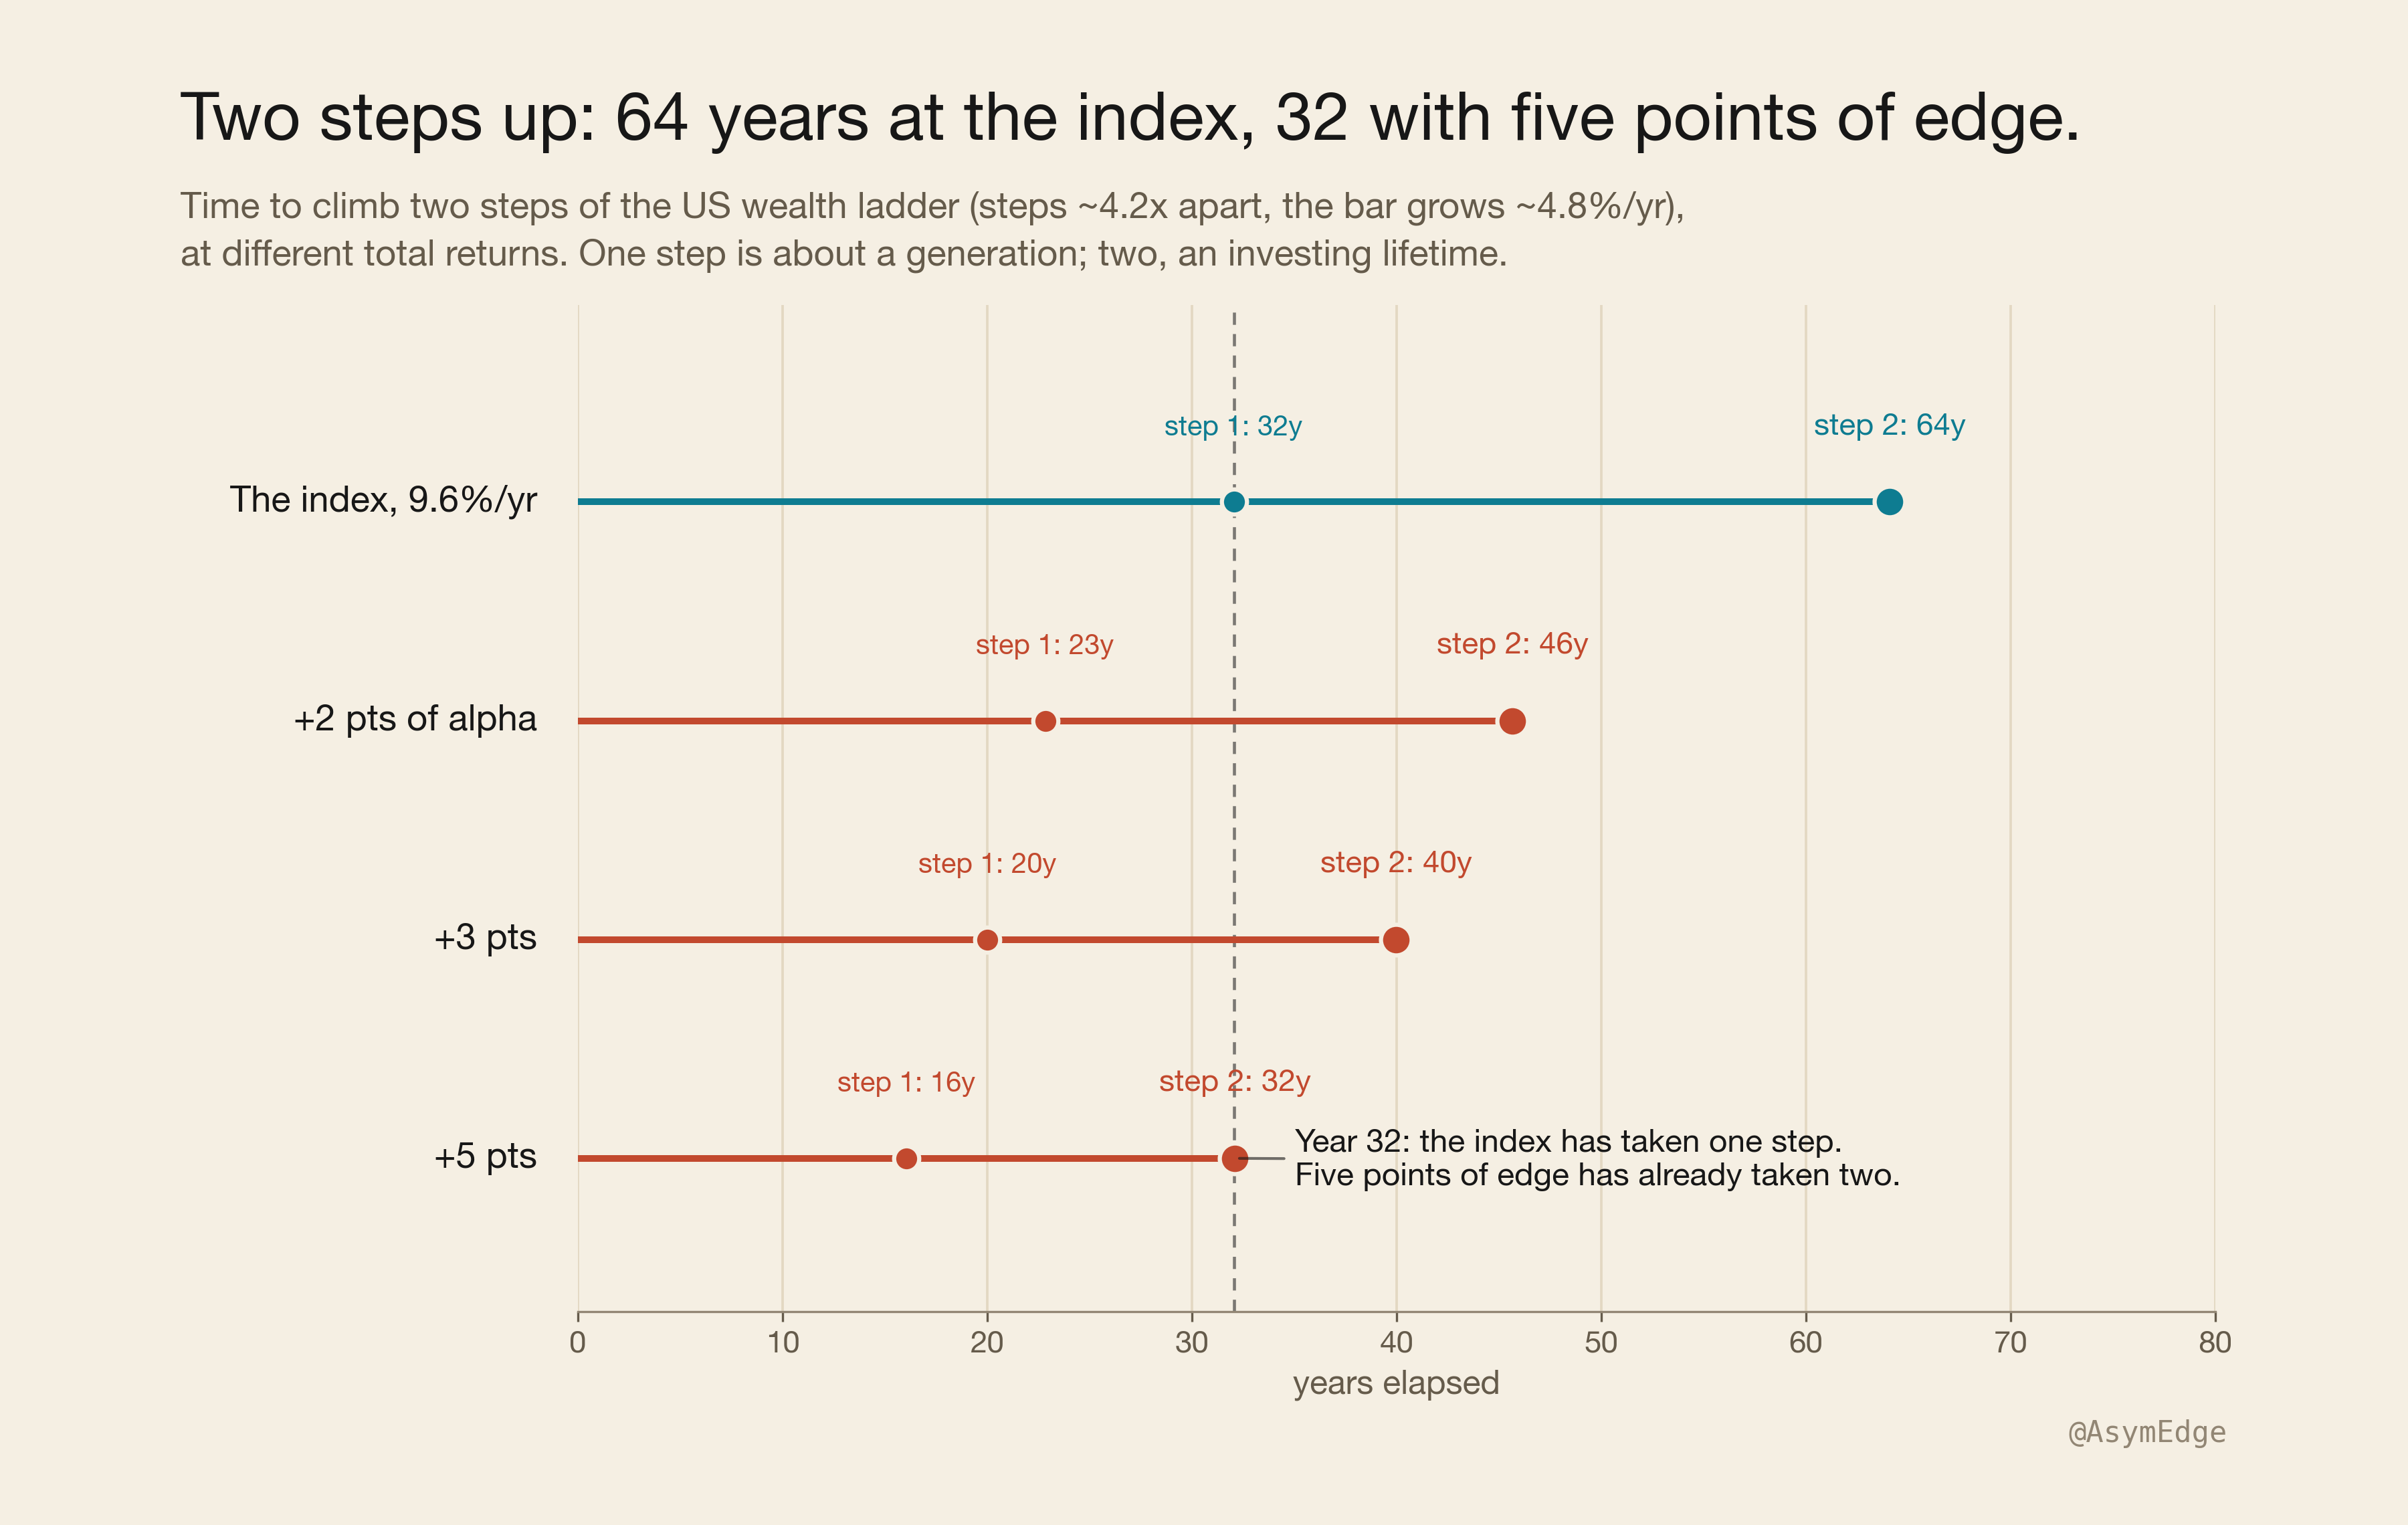
Turn the ladder from dollars into years. Each step costs about 4 times more than the one below it, and the bar grows about 4.8% a year. Your speed up the ladder is just your return minus that 4.8%.
At the index’s 9.6%, you climb one step every 32 years or so.
Beat the index by two points and it’s 23 years. By three, 20. By five, 16.
The index is basically an escalator. One step per generation, two steps in an investing lifetime. The 1929 money climbed roughly on that schedule: 1954, then 1989.
So I see alpha as time. Five extra points of return per year double your speed up the ladder, and that’s the whole prize of picking stocks well, measured in the only unit a ladder understands: years.
The line between climbing and falling behind sits near 5% a year, the bar’s own speed. Cash falls under that line, which is why cash loses ground. Almost any mostly-stock mix clears it.
The one step the escalator misses
Concentration is the only thing that beats the escalator. It’s also where some of the leakage comes from that feeds the escalator in the first place. You can see both in the one step the escalator misses, the exception I promised earlier.
Top 0.001%. About 2,500 adults, entry around $1.5 billion. The steps below are roughly 4 times apart, but this one is 13 times the step beneath it. The 1929 money, two steps up after 93 years, never gets close. The index fails here in 9 of the 90 windows, seven of them clustered around one boom that repriced the tip. (Exact years and the 30-year retest are in the method note.)
The very top is the only bar that sometimes grows at founder speed, because it’s set almost entirely by brand-new fortunes. Up there the ladder is really just a list of names, and the names keep changing. What sometimes beats the index up here is the bar itself, reset by whoever just built a new fortune.
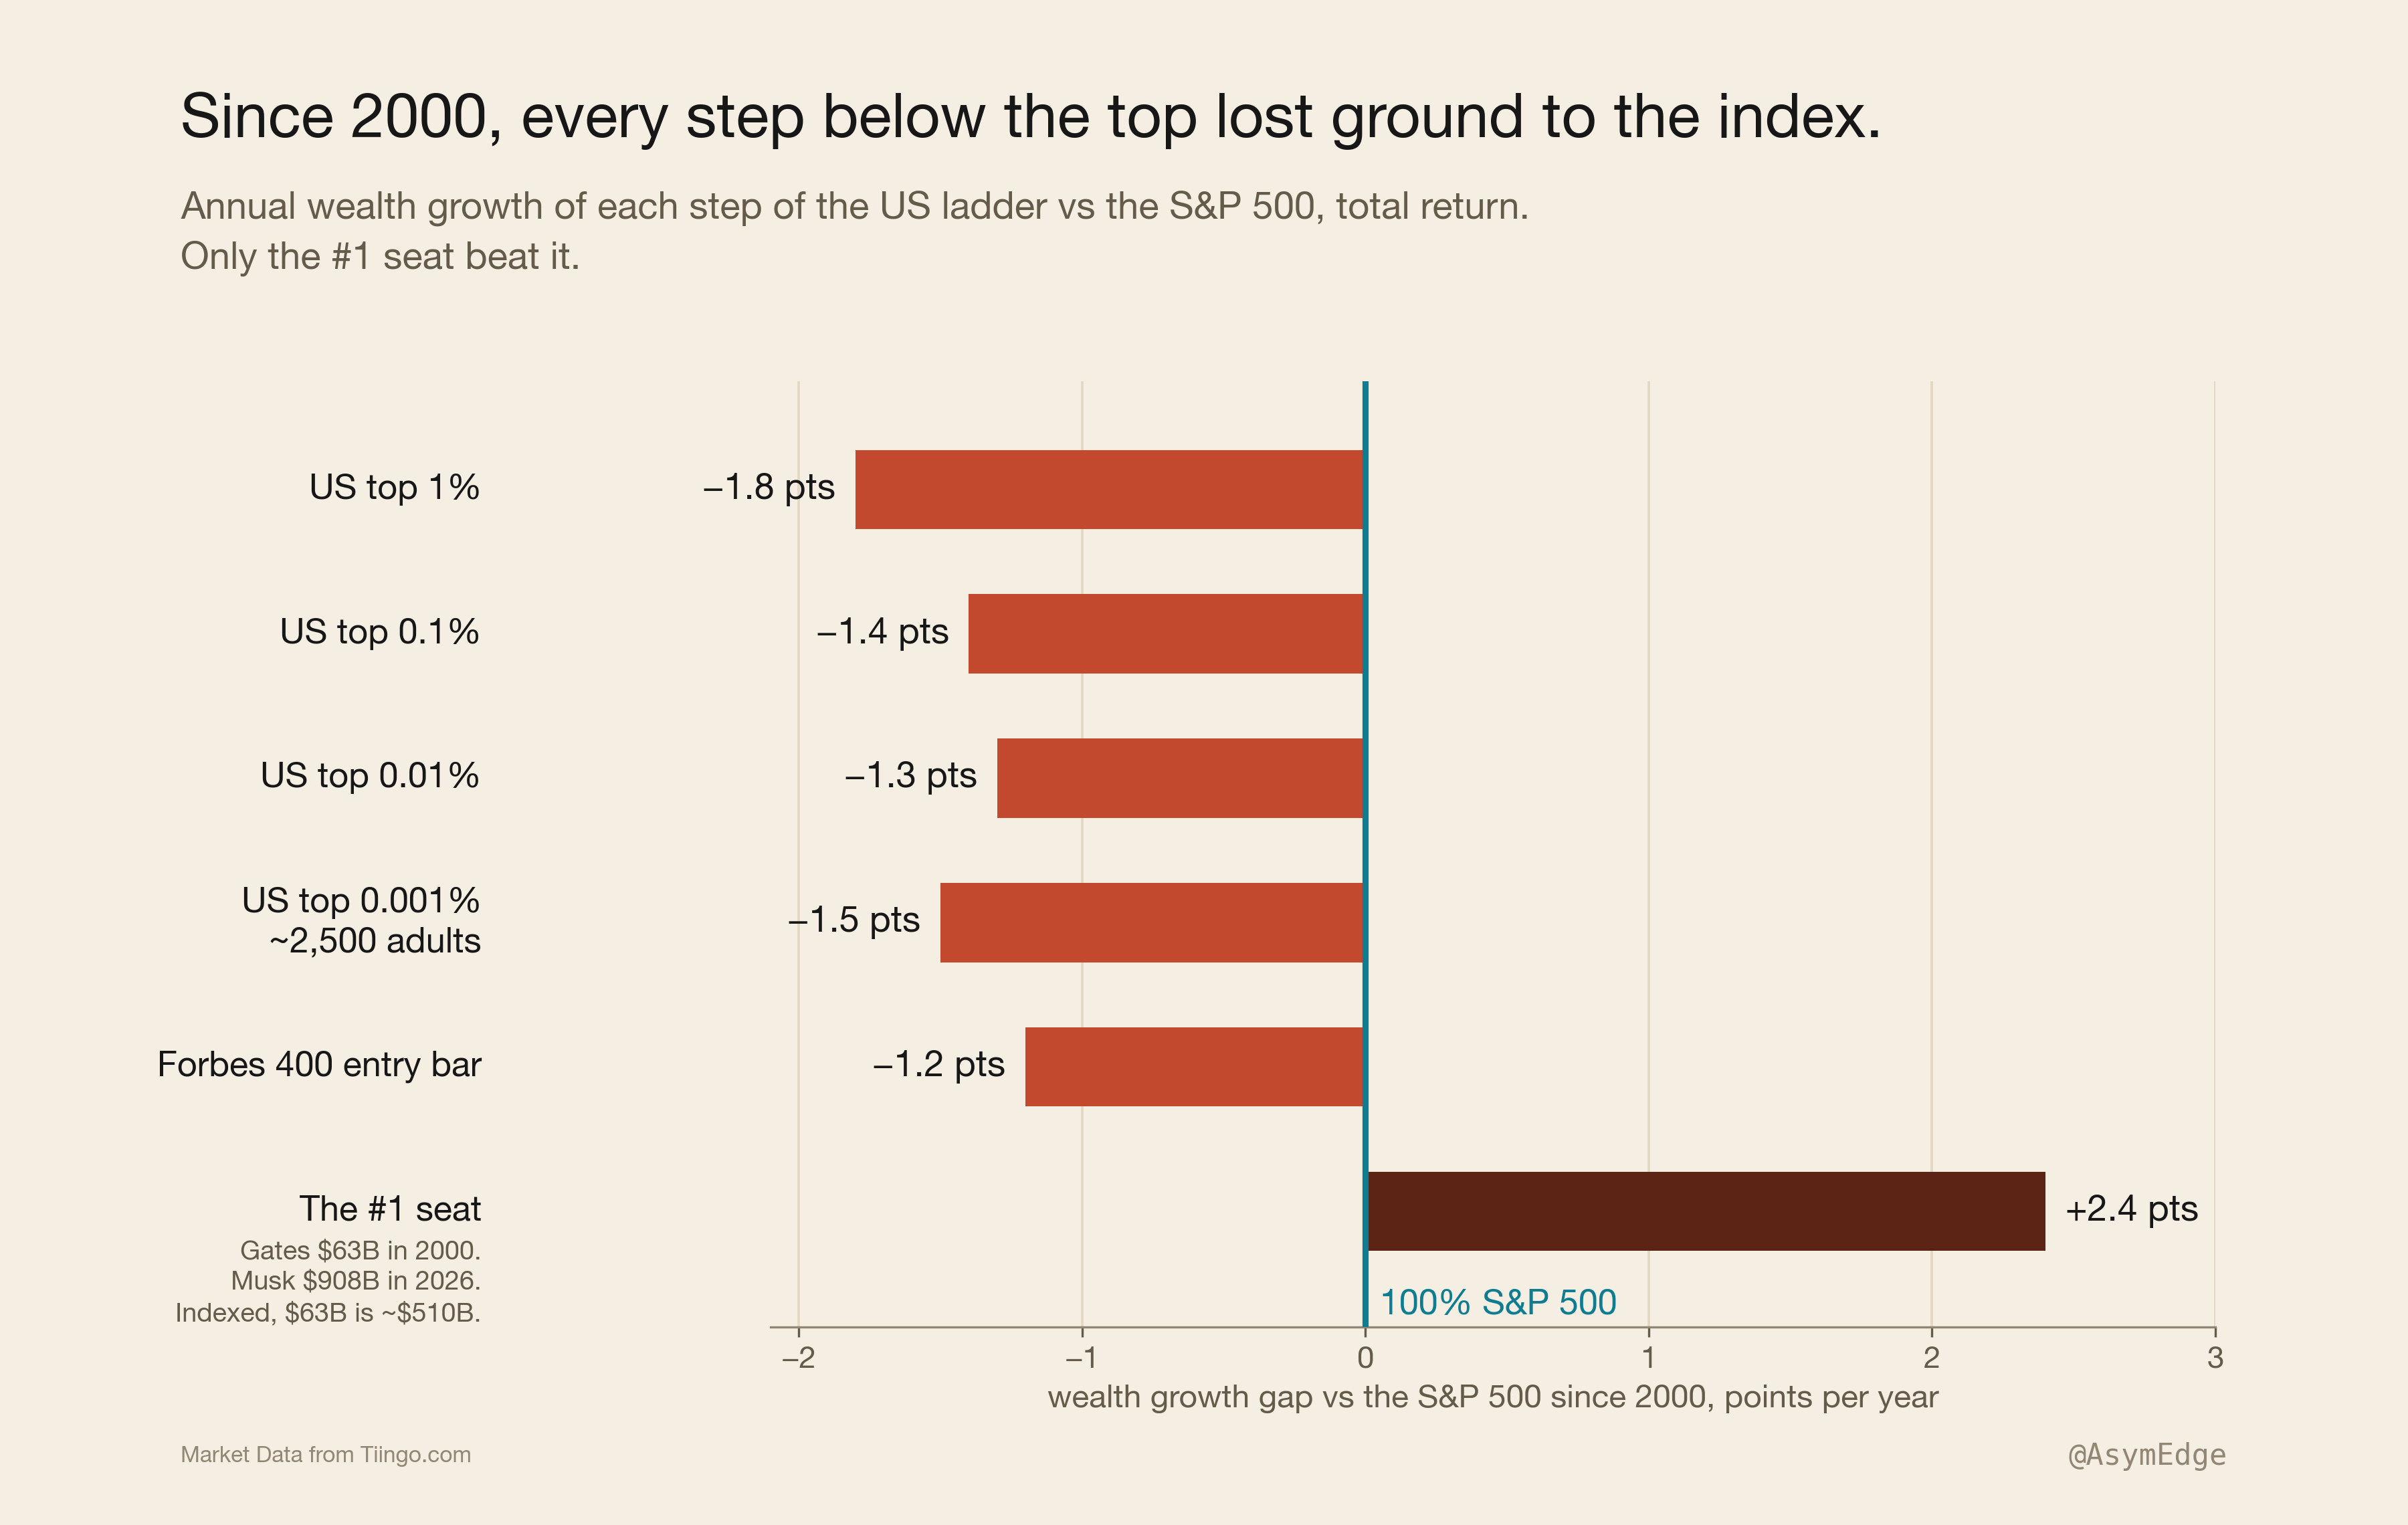
Since 2000, the top seat beat the index. Gates topped the 2000 rich list at $63 billion. Musk topped the 2026 list at $908 billion.
Put that same $63 billion in the index for those 26 years instead, and you’d have about $510 billion.
This isn’t a knock on Gates, who spent those years deliberately giving the money away. The point is the seat itself, whoever sits in it. The most expensive seat on earth grew 10.8% a year while the index grew 8.4%. So at the very top, where the bar is set by brand-new fortunes, money that just sat still couldn’t keep up. In those 26 years, the hardest stretch for the escalator, every step below the top still lost ground to the index.
Climb with concentration, keep with the index
Buffett is the clearest example of both halves of this. His fortune came from decades of concentration, the fast track, ridden longer than anyone else alive.
His will tells his wife’s trustee to hold 90% S&P 500 and 10% Treasury bills. The escalator. That mix passes the test every time since 1934, 69 windows, 69 holds, median 2.3x.
I used to think that instruction was modesty. Now I think it’s this whole result, said in one sentence: climb with concentration, keep with the index.
Which answers the question I kept asking myself while writing this. If the index already solves staying rich, why do I spend my days picking stocks? Because I’m not standing on the step I plan to stop on, and the escalator takes 32 years to reach the next one.
This whole exercise put a real number on my job. Beating the index by five points is worth about 16 years of my life: one step takes 32 years at the index’s pace, 16 with a five-point edge. That’s what I’m buying by picking stocks, if I really have the edge. Whether I do is a separate question, and this piece doesn’t answer it.
The index is the bar every pick has to beat, and it’s also where I’ll park the money once I’m done climbing. And remember what actually explains the gap: the bar is slow because the people above me leak money to taxes, spending, and splits. Bad stock picking explains only a small part of it. Picking stocks still works. This data just puts a price on it.
Caveats
A result this clean deserves some skepticism, so here’s what the clean version leaves out. Then the short version.
The numbers so far have no taxes or fees in them, and those costs add up. A cheap fund today, sitting mostly on gains you haven’t sold, lives near the 1-point-of-drag line, still 90 out of 90.
A top-bracket American in the middle of the century didn’t have it that easy. Dividends were taxed as regular income, at rates up to 63-94%, on yields of 4-6% a year. That alone is 3-5 points of drag.
And nobody could even buy an index fund before 1976. So 90 out of 90 is the best case. What you could actually buy and hold, after tax, comes closer to 81 out of 90.
The escalator still works. It just wasn’t always this perfect.
The margin has also thinned lately. The last eight starting years, 1995 through 2002, finish between 1.4x and 2.5x, below the century’s median of 2.8x, because concentrated fortunes since 1980 have pushed the bars up faster. The floor still held. There’s just less room above it now.
And this is the US, the best-performing market of the century, in its own currency. Run the same test in Germany or Japan, and whatever happens to your rank, your actual wealth gets wiped out, because the bar falls just as hard as your money does. Rank is graded on a curve, and in a real disaster the curve is doing all the work. Keeping your rank through the Depression is not the same as being fine. The real money took 13 years to recover.
Two smaller points. The wealth bars after 2022 aren’t final yet, which is why the test stops there. And this whole effect only exists because the people above you don’t all hold the index and don’t stop spending. If they ever did both, the gap would close. They won’t.
The short version
So the slide down the wealth ladder I’d assumed my whole life isn’t real. The ladder has an escalator, and it moves one step per generation. Getting rich is still the hard part. That takes concentration, played against the leakage that eats everyone above you. Staying rich, on 110 years of evidence, was just an index fund and 20 years of leaving it alone.
Just don’t ask the ticket to feed you.
Method note
Wealth entry bars are per adult (couples split equally), annual since 1913, kept in nominal dollars via the dataset’s own price index, so the deflator cancels in the ratio.
The market leg is the S&P 500 total return, using its predecessor composite index before the S&P 500 launched in 1957; it compounds monthly, each month adding the price change plus one-twelfth of the annual dividend rate, measured at December values. Dividends are reinvested gross, with no dividend tax taken out; mid-century that flattered the result, and the Caveats section prices exactly how much. The 9.6% a year is the median 20-year window (the full 1913-2022 stretch compounds at 10.1%), and the series matches a second, independent source on the 2000-2022 overlap, where both give 7.0% a year.
Bills are 3-month Treasury rates, calendar-year averages, compounded annually; cash holds rank in 21 of 69 windows, every one of them starting between 1955 and 1977. The Buffett mix is rebalanced annually and holds rank in all 69 of its windows, median 2.3x.
Time per step uses ~4.2x spacing between steps (the actual ratios are 3.96x from the top 1% to the top 0.1%, and 4.41x from the top 0.1% to the top 0.01%) and the bars’ ~4.8% median annual growth.
The top 0.001%’s nine failures: seven start between 1963 and 1972 and end in the 1983-to-1992 boom, when a new generation of fortunes repriced the tip; the other two start in 1988 and 1998; the worst miss ends 22% short; stretched to 30 years, this step holds 96% of the time.
Two limits on the data. The entry bars are a modern reconstruction of past distributions, not figures published at the time, and the academic series behind them has been revised before. Revisions can move the bars, but they give the simulated investor no hindsight edge: the investor never acts on the bars, which only grade the outcome.
And the Gates comparison runs to 2026, four years past the main dataset; its 8.4% a year index rate is the one return figure here not recomputed from the Shiller series. All of it describes the past, and the past included regime breaks.
Sources
- Wealth entry bars: World Inequality Database (wid.world), US series by Piketty, T., Saez, E. & Zucman, G., “Distributional National Accounts: Methods and Estimates for the United States,” Quarterly Journal of Economics 133(2), 2018; building on Saez, E. & Zucman, G., “Wealth Inequality in the United States since 1913: Evidence from Capitalized Income Tax Data,” Quarterly Journal of Economics 131(2), 2016.
- S&P 500 total return, including the pre-1957 composite: Robert Shiller, Yale University, “U.S. Stock Markets 1871-Present and CAPE Ratio,” econ.yale.edu/~shiller/data.htm.
- 3-month Treasury bill rate: FRED series TB3MS, Federal Reserve Bank of St. Louis.
- Estate tax (77% top rate, 1941-1976): Tax Policy Center and Congressional Research Service historical tables.
- Income and dividend tax (63% top rate from 1932, 94% in 1944-45, above 90% through 1963): Tax Foundation historical tables.
- Bill Gates ($63B) and Elon Musk ($908B): Forbes 400, September 2000 and September 2026.
- S&P 500 total return since 2000 (the 8.4% a year in the Gates comparison): SPDR S&P 500 ETF (SPY), Market Data from Tiingo.com.
- Share of adults with $1M or more, global and Switzerland: UBS Global Wealth Report 2026, published 30 June 2026.
- Küsnacht luxury home prices: UBS Luxury Property Focus 2026, with dollars converted to francs at 0.83 (October 2026).
- Buffett’s 90/10 instruction: Berkshire Hathaway 2013 shareholder letter.
- Adult population: US Census Bureau.
Educational only, not financial advice.